Data science and specifically artificial intelligence are growing in popularity, usability, functionality, and in mass awareness. This guide includes an overview of data science and it also includes real-life case studies. I try to be as transparent as possible with everything I have accomplished and I hope you find it helpful!
Below are the two main objectives of leveraging data science applications to solving real world problems:
- Actionable, computationally intensive data analysis will empower business functions during critical decision making and will enable you to increase customer win and retention rates; allowing you to always make calculated moves.
- A comprehensive data and analytics program will accelerate your business development efforts, reduce your risk exposure during litigious activities, advance your most profitable offering, and work as a catalyst to offer best in class customer service.
I always like to break out all data science applications in four bins, sales analytics, risk analytics, premium analytics, and operational analytics. I have included some major applications of how I have leveraged data science solutions under each bin and this list is growing as I continue helping companies achieve their goals.
Sales Analytics
- Lead prioritization
- Demand forecasting
- Up/cross-selling algorithms
- Predictive modeling
Risk Analytics
- Client entrenchment
- Competitive analysis
- Win/Loss analytics
- Targeted marketing
Premium Analytics
- Behavioral forecasting
- Revenue and Margin forecasting
- Benchmarking vs. peers
Operational Analytics
- Log / Web analytics
- Text mining (surveys)
- Channel optimization
- Volume forecasts
Table of Contents
How can data science help you?

How mature is your data analytics program today?
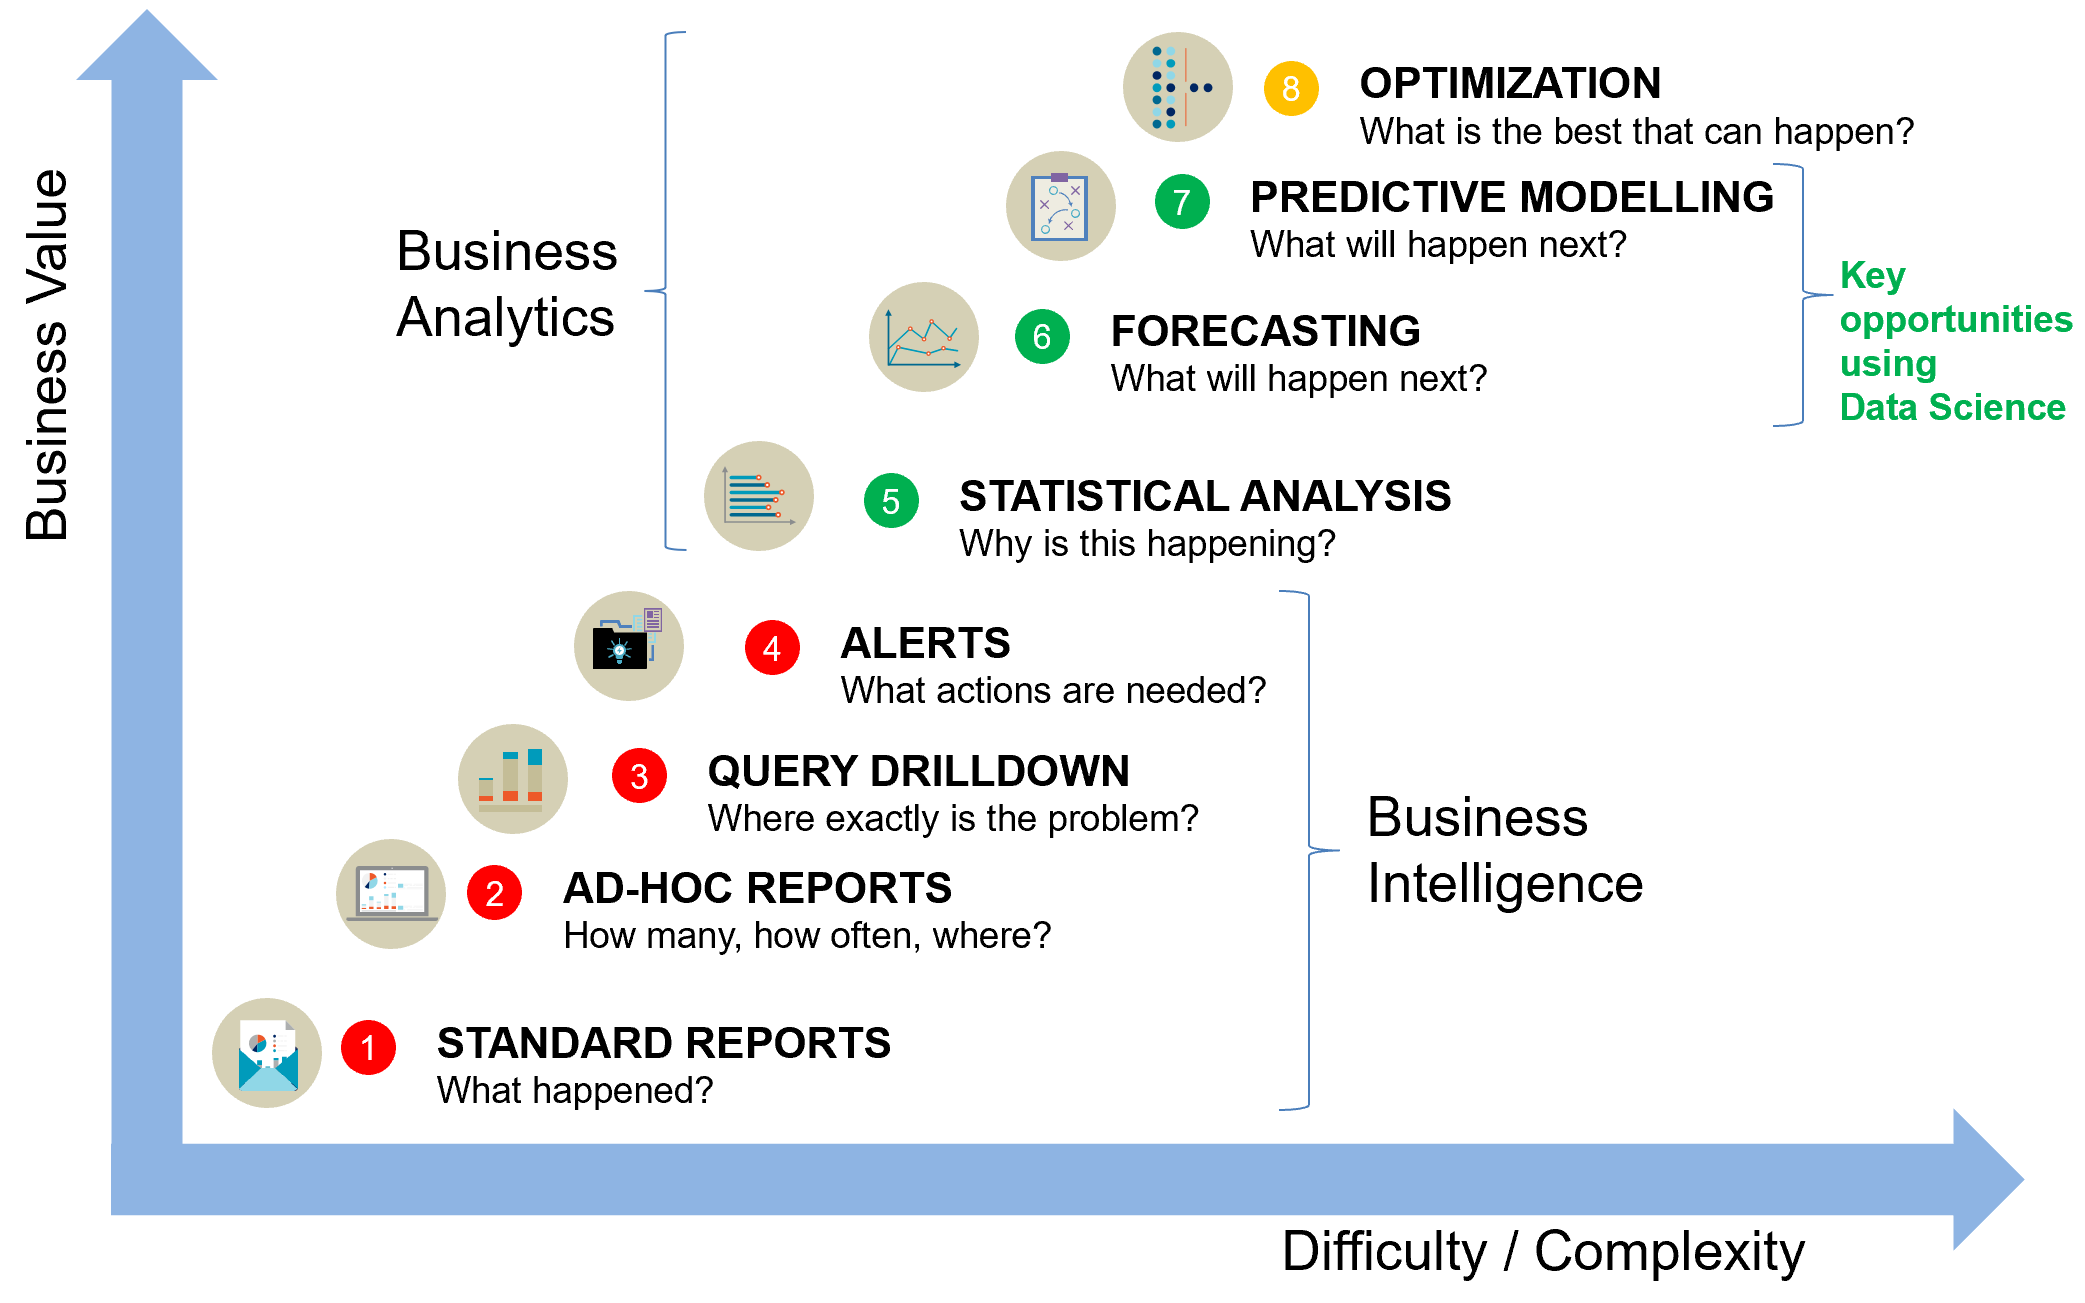
Of course, before jumping right into the applications, it is critical that you perform an honest, unbiased, and objective audit of your existing program. This means, how ready are you and your company to pursue these types of opportunities? Some of these may not apply to your particular industry vertical while others may be immense opportunities for your particular circumstances. This is a chart I created that helps you assess the maturity level of your existing data analytics programs today.
You will notice in the below chart that when the stage of maturity reaches level 5, things get fun and very interesting! You can begin asking yourself “Why is this happening”, as in, why are we losing clients at such a rapid rate? Why aren’t we winning more clients? Why aren’t we retaining more clients? Why aren’t we growing in these 3 particular markets? You will not be able to accurately forecast until you have properly analyzed your existing point of departure, in other words, there is no point of workings towards your point of arrival without first comprehending your existing business conditions. Maturity Stage 6- Forecasting, Maturity Stage 7- Predictive Modelling, and Maturity Stage 8- Optimization is when the real data science comes into play. This can typically be accomplished with a seasoned data scientist, combined with someone responsible for data preparation, data transformation, data harmonization, and finally data visualization. These last three stages present the most opportunities for companies looking to properly pursue data science.
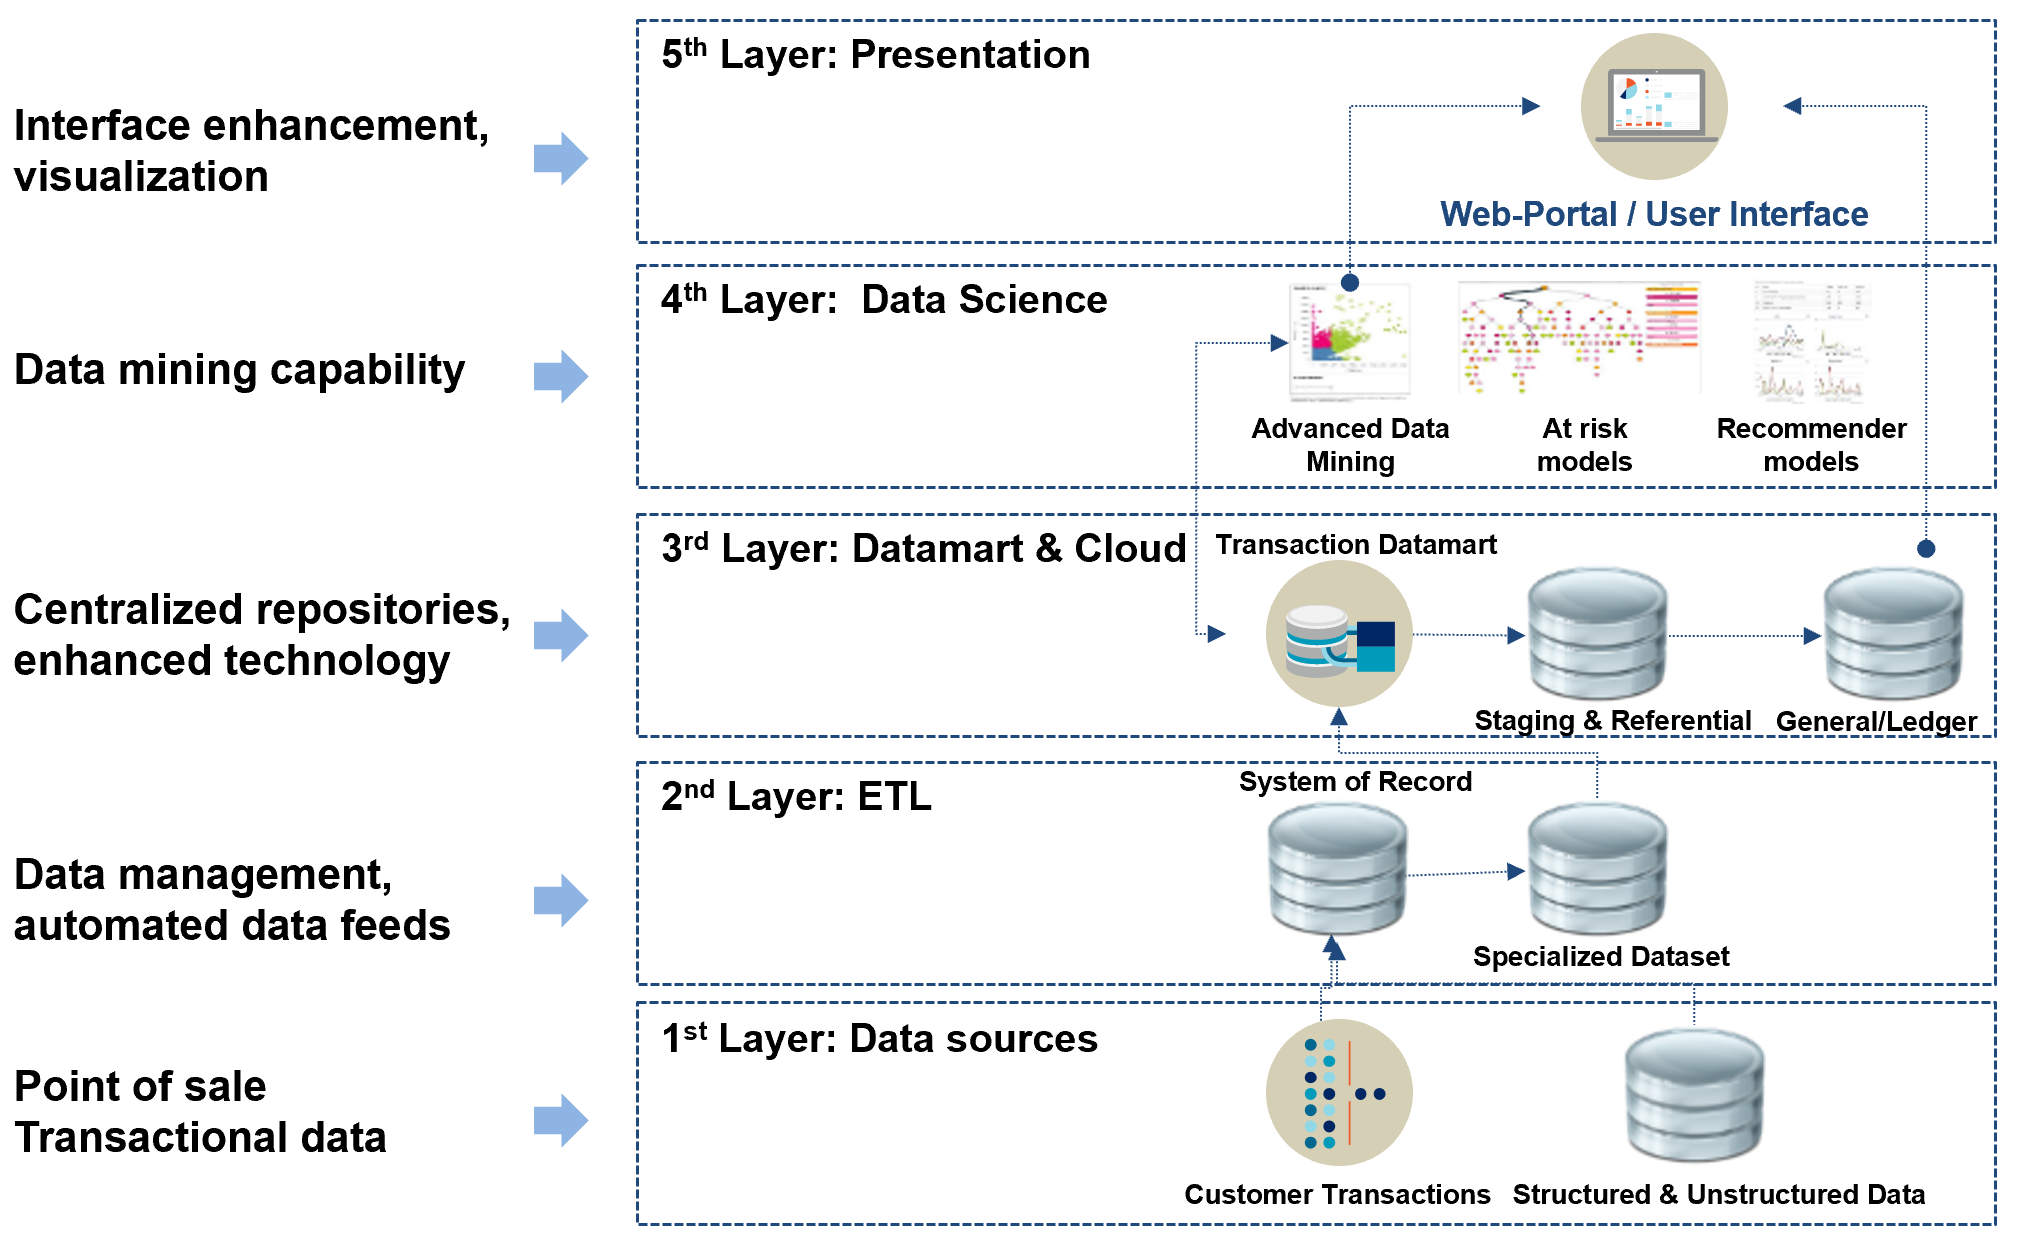
What is a best-in-class technology architecture?
The technology stack should align well with your overarching plans for data analytics and leveraging Big Data long-term. This is one of the most important points that is often neglected. I do not suggest blindly investing in top of the line technology tools and products which cost an extraordinaly high price, however, it is absolutely imperative that a strong technological foundation is created, so you are prepared to continue scaling the platform as new applications arise.
 Now, let’s focus on real-life case studies, these are all examples of how I have helped companies, please do not hesitate to ask if you have any questions about the tools used, implementation strategy, measurable benefits of each solution, or anything at all.
Case Study 1: How can we improve client acquisition rate?
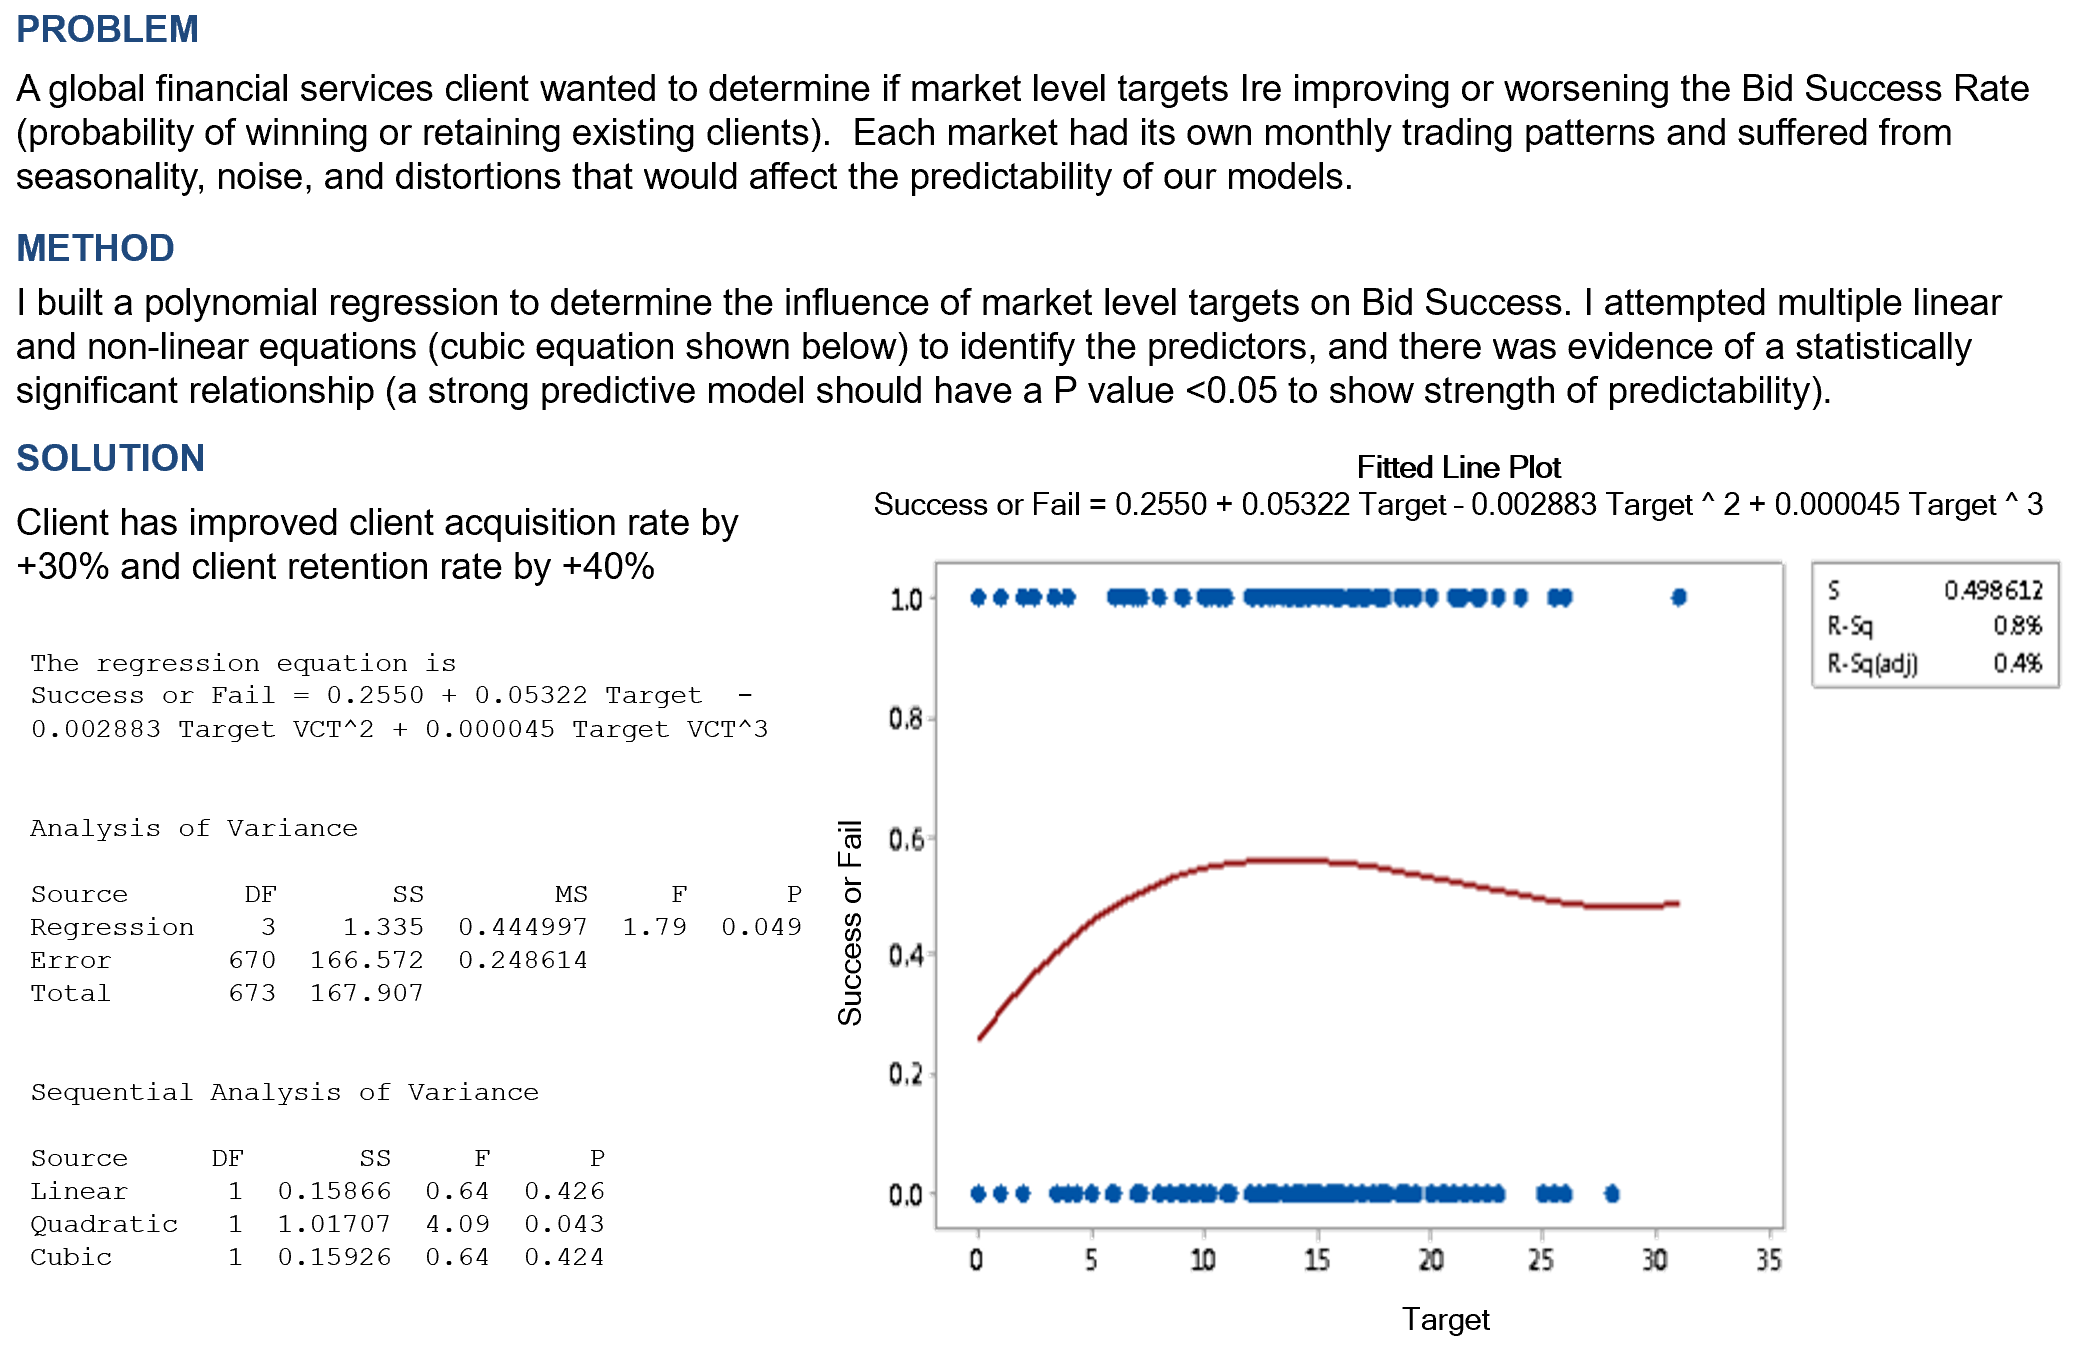
Problem
A global financial services client wanted to determine if market level targets were improving or worsening the Bid Success Rate (probability of winning or retaining existing clients). Each market had its own monthly trading patterns and suffered from seasonality, noise, and distortions that would affect the predictability of our models.
Method
I built a polynomial regression to determine the influence of market level targets on Bid Success. I attempted multiple linear and non-linear equations (cubic equation shown below) to identify the predictors, and there was evidence of a statistically significant relationship (a strong predictive model should have a P value <0.05 to show strength of predictability).
Solution
Client has improved client acquisition rate by +30% and client retention rate by +40%
Case Study 2: How do I create a sales incentive model?
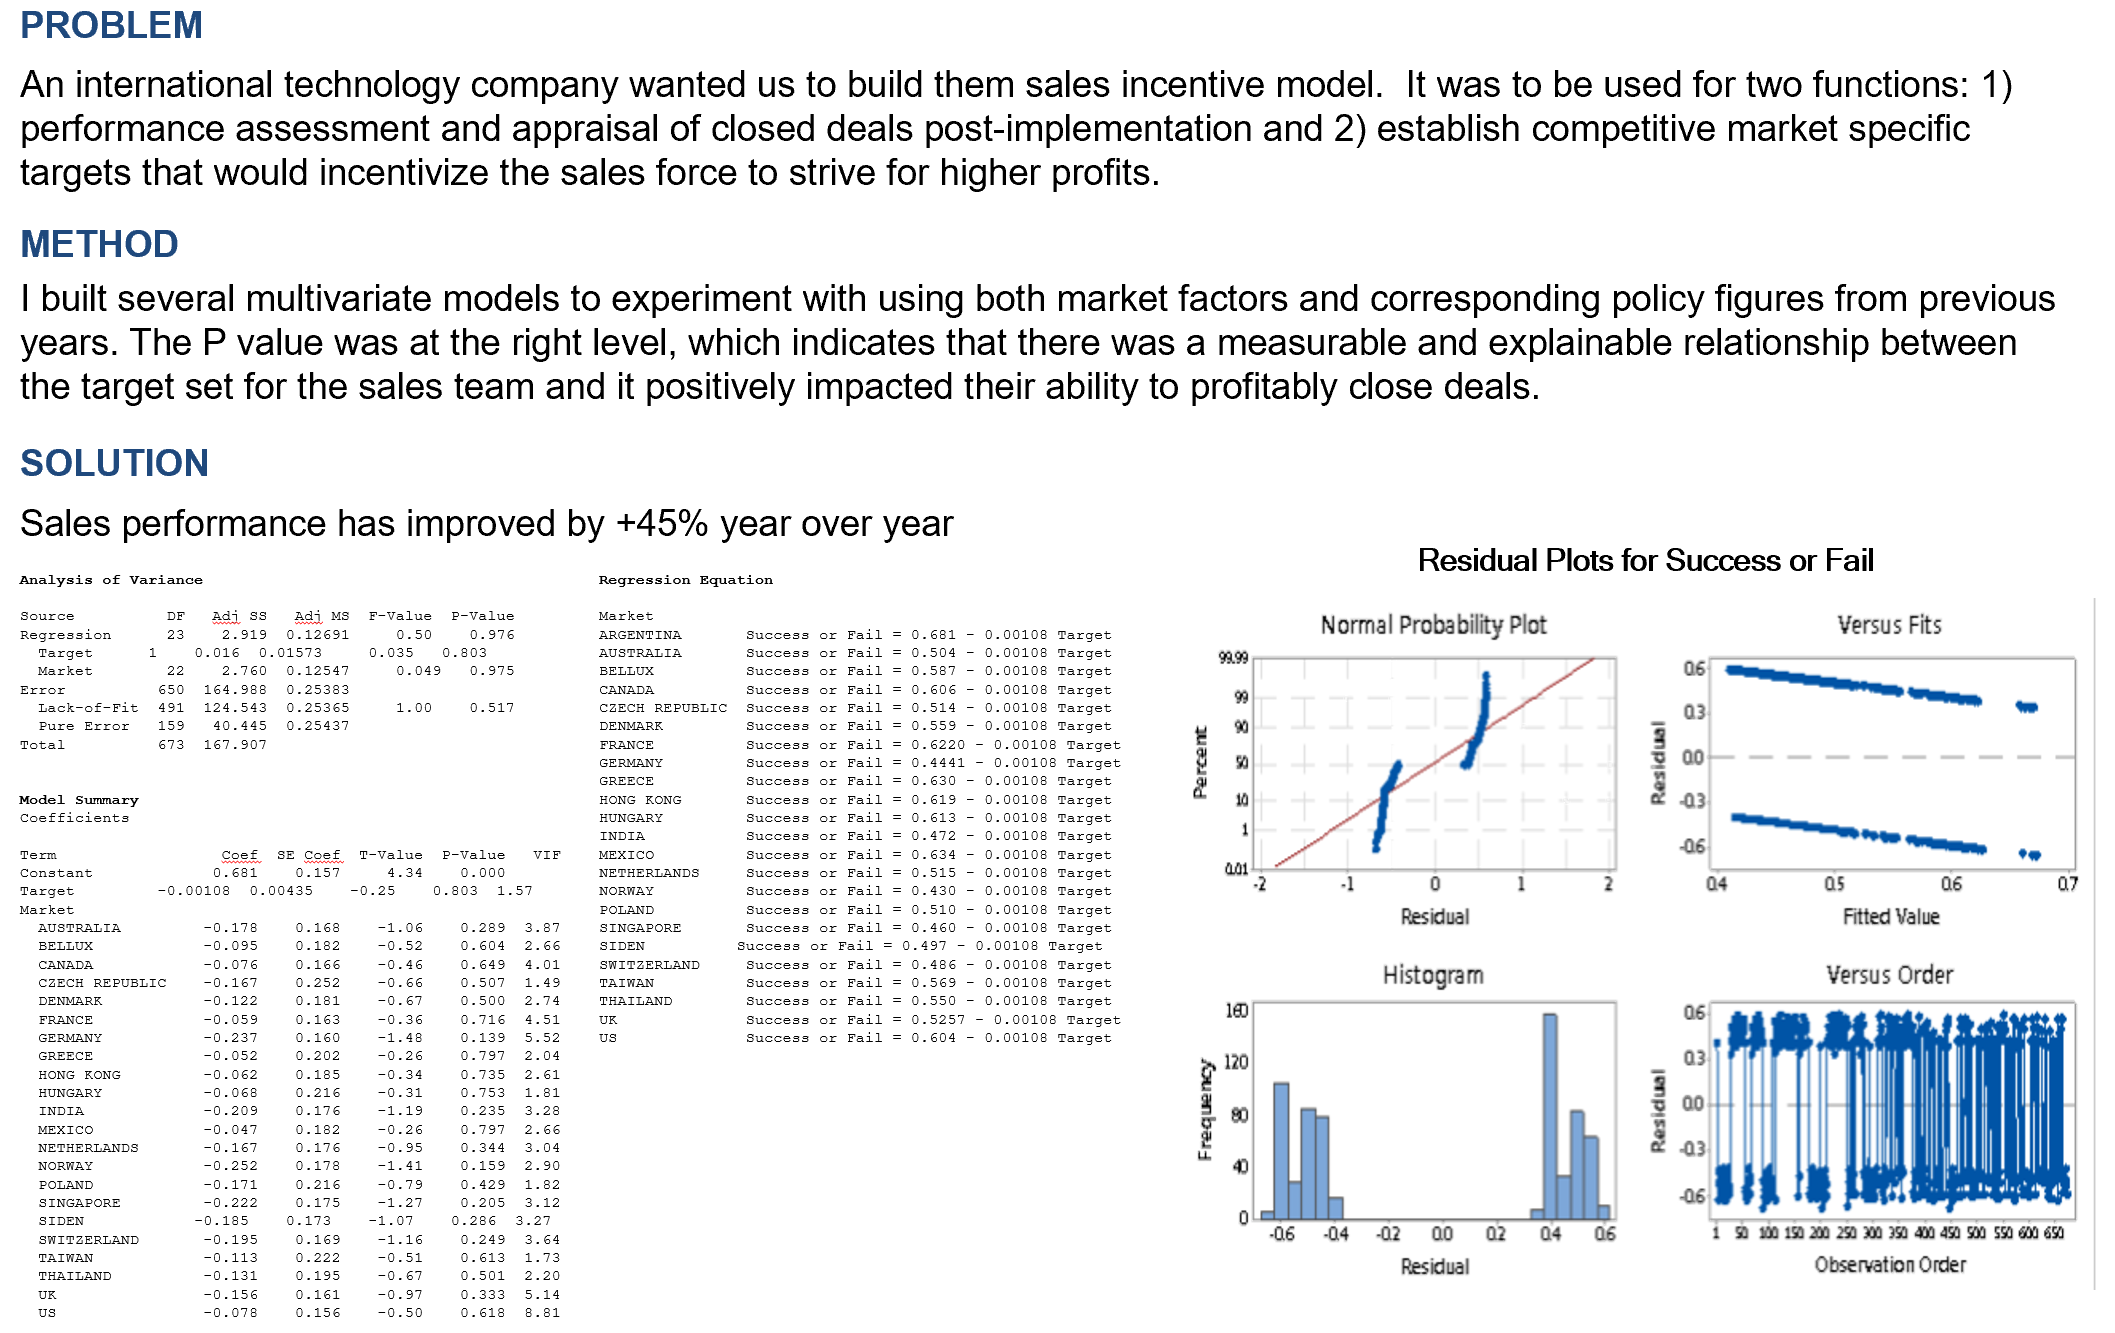
Problem
An international technology company wanted us to build them sales incentive model. It was to be used for two functions: 1) performance assessment and appraisal of closed deals post-implementation and 2) establish competitive market specific targets that would incentivize the sales force to strive for higher profits.
Method
I built several multivariate models to experiment with using both market factors and corresponding policy figures from previous years. The P value was at the right level, which indicates that there was a measurable and explainable relationship betIen the target set for the sales team and it positively impacted their ability to profitably close deals.
Solution
Sales performance has improved by +45% year over year
Case Study 3: What will my sales be next year?
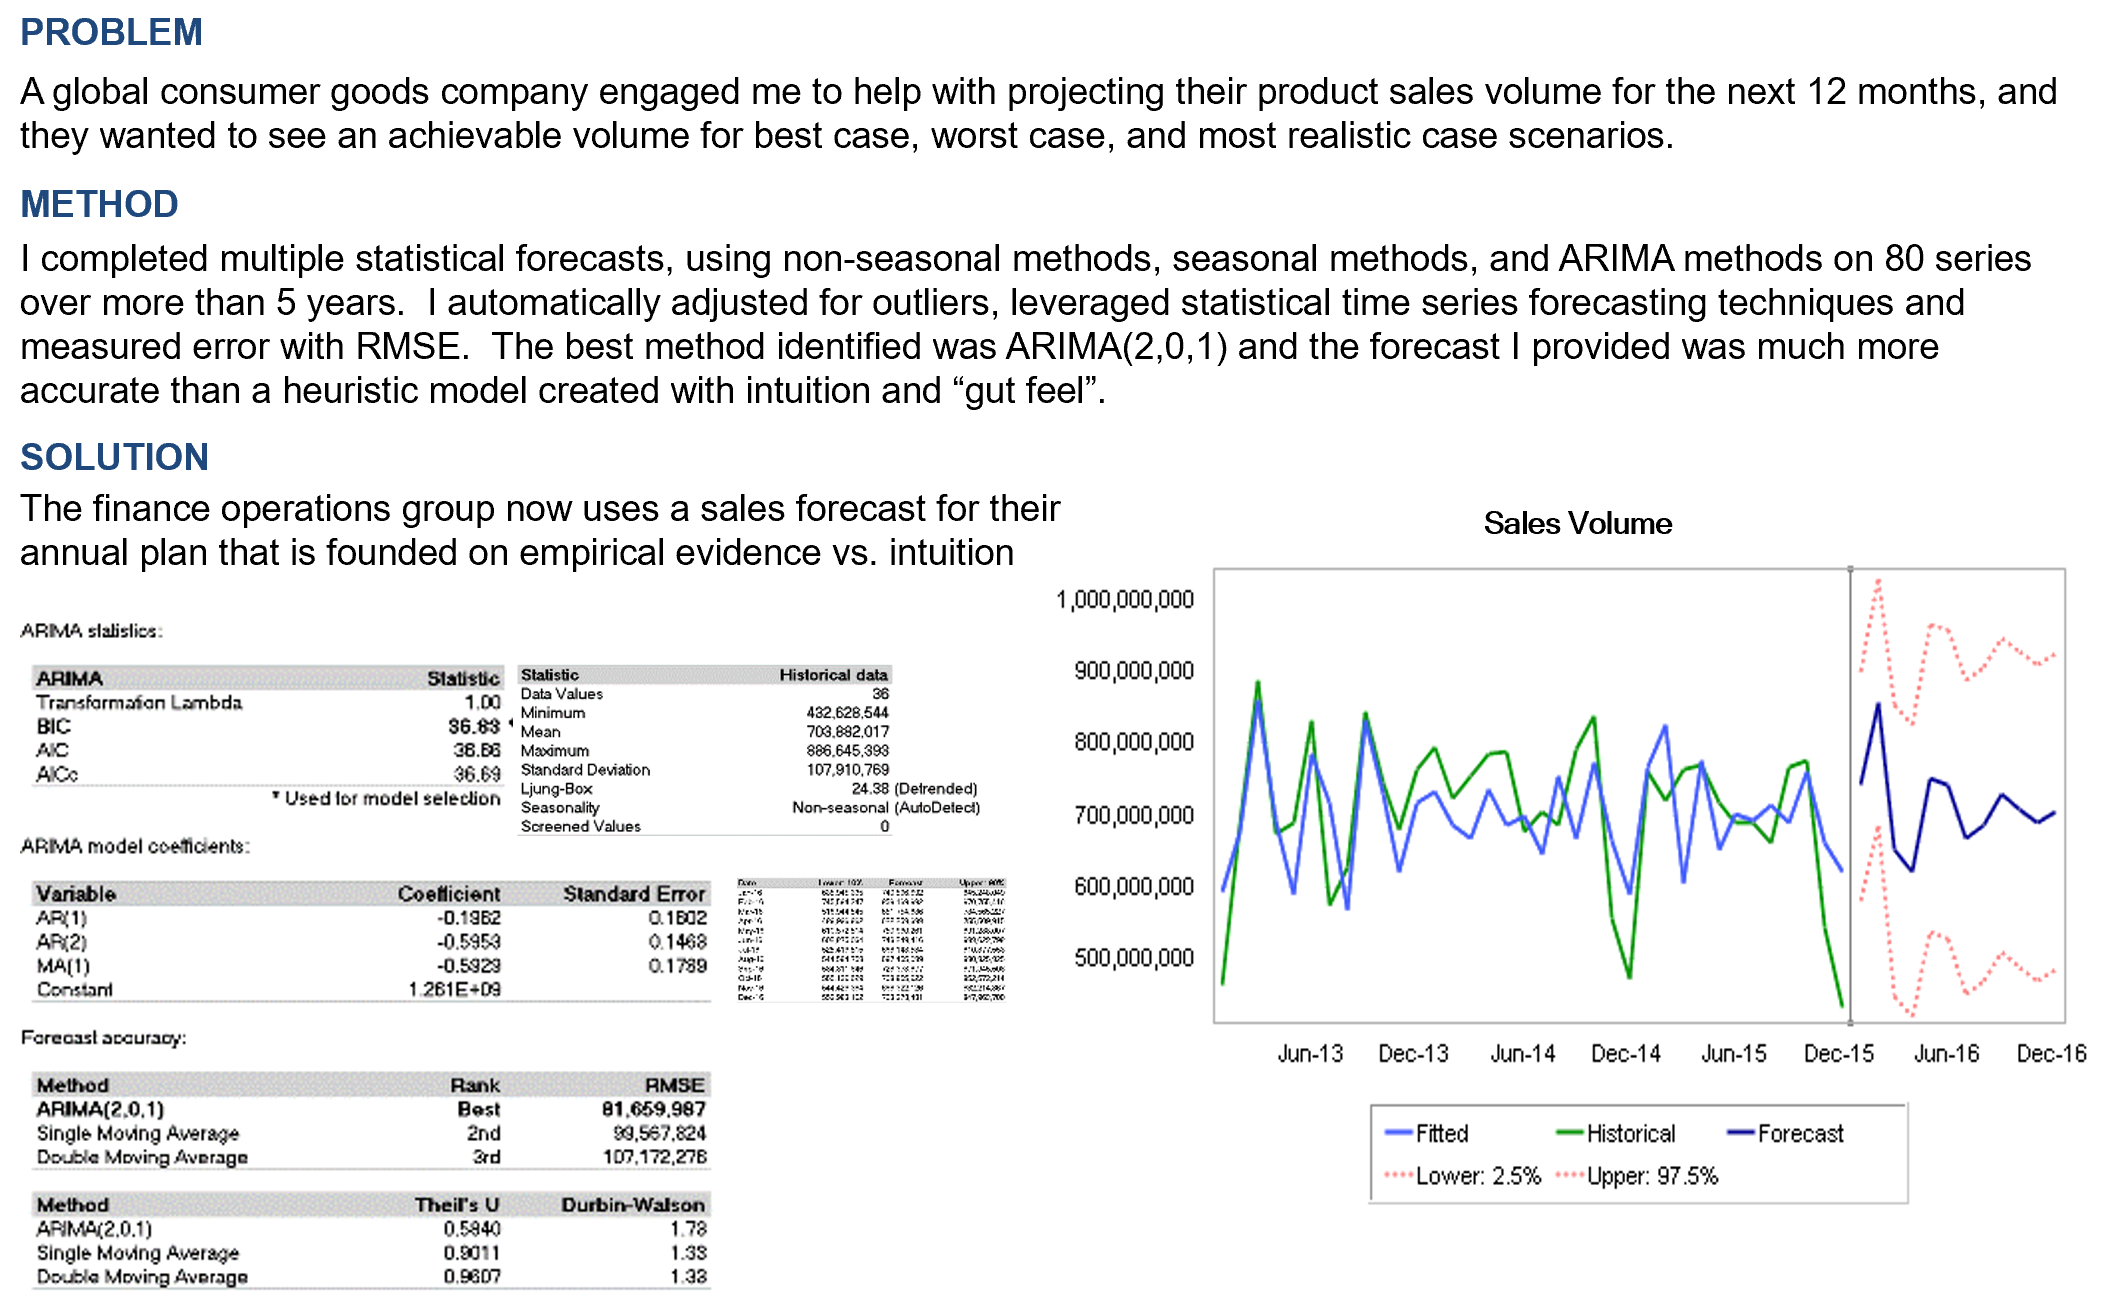
Problem
A global consumer goods company engaged me to help with projecting their product sales volume for the next 12 months, and they wanted to see an achievable volume for best case, worst case, and most realistic case scenarios.
Method
I completed multiple statistical forecasts, using non-seasonal methods, seasonal methods, and ARIMA methods on 80 series over more than 5 years. I automatically adjusted for outliers, leveraged statistical time series forecasting techniques and measured error with RMSE. The best method identified was ARIMA(2,0,1) and the forecast I provided was much more accurate than a heuristic model created with intuition and “gut feel”.
Solution
The finance operations group now uses a sales forecast for their annual plan that is founded on empirical evidence vs. intuition
Case Study 4: What is our biggest market opportunity?
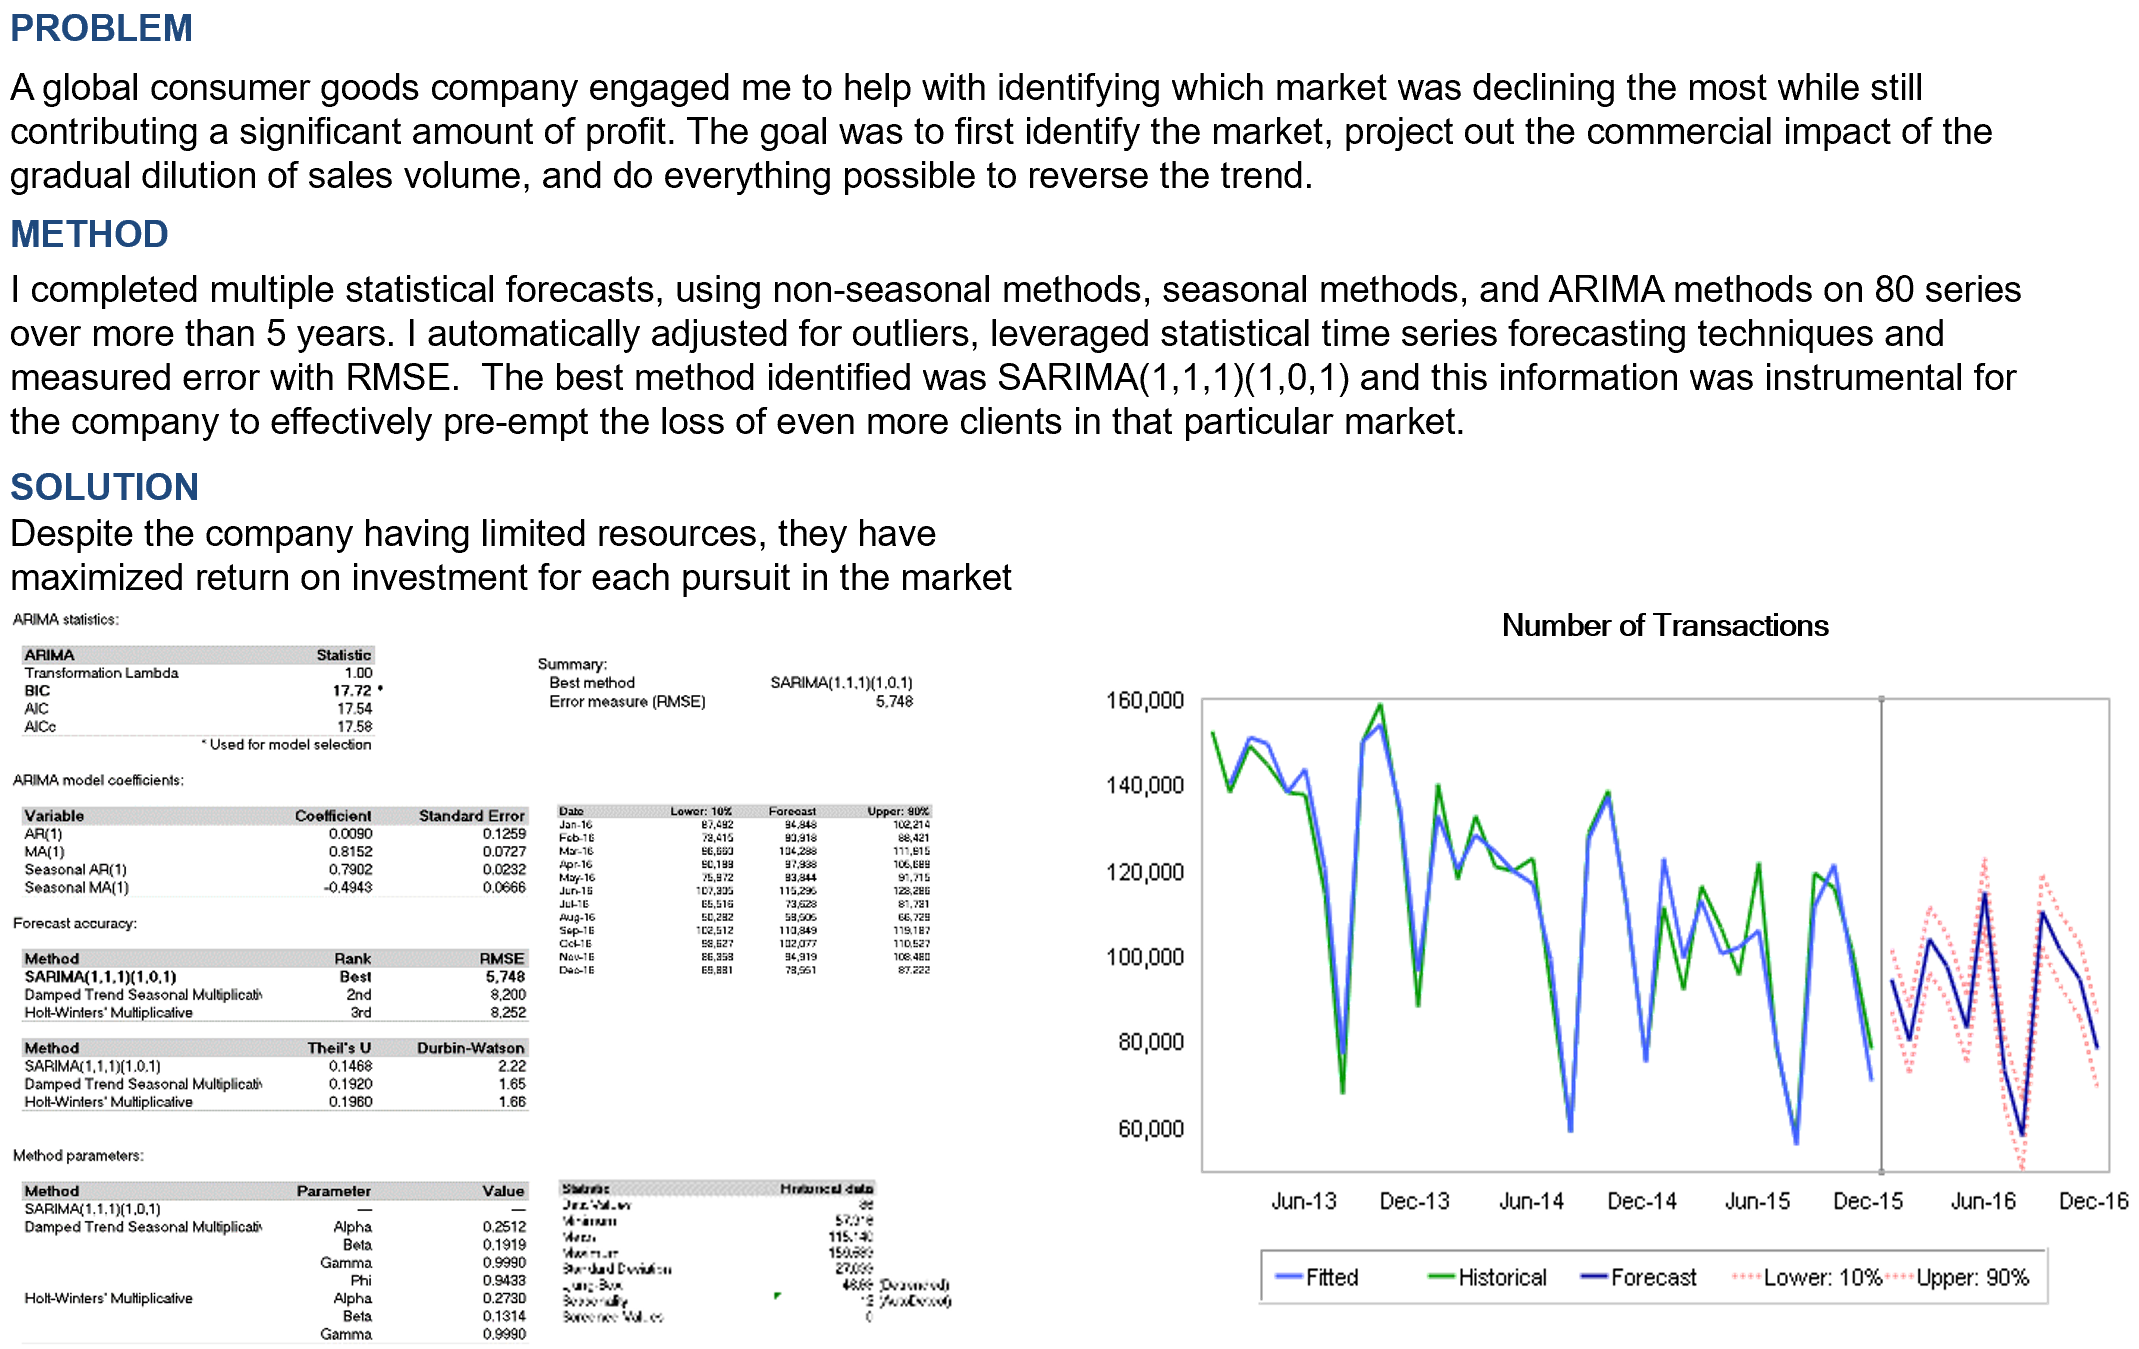
Problem
A global consumer goods company engaged me to help with identifying which market was declining the most while still contributing a significant amount of profit. The goal was to first identify the market, project out the commercial impact of the gradual dilution of sales volume, and do everything possible to reverse the trend.
Method
I completed multiple statistical forecasts, using non-seasonal methods, seasonal methods, and ARIMA methods on 80 series over more than 5 years. I automatically adjusted for outliers, leveraged statistical time series forecasting techniques and measured error with RMSE. The best method identified was SARIMA(1,1,1)(1,0,1) and this information was instrumental for the company to effectively pre-empt the loss of even more clients in that particular market.
Solution
Despite the company having limited resources, they have maximized return on investment for each pursuit in the market
Case Study 5: Can you forecast multiple economic variables?
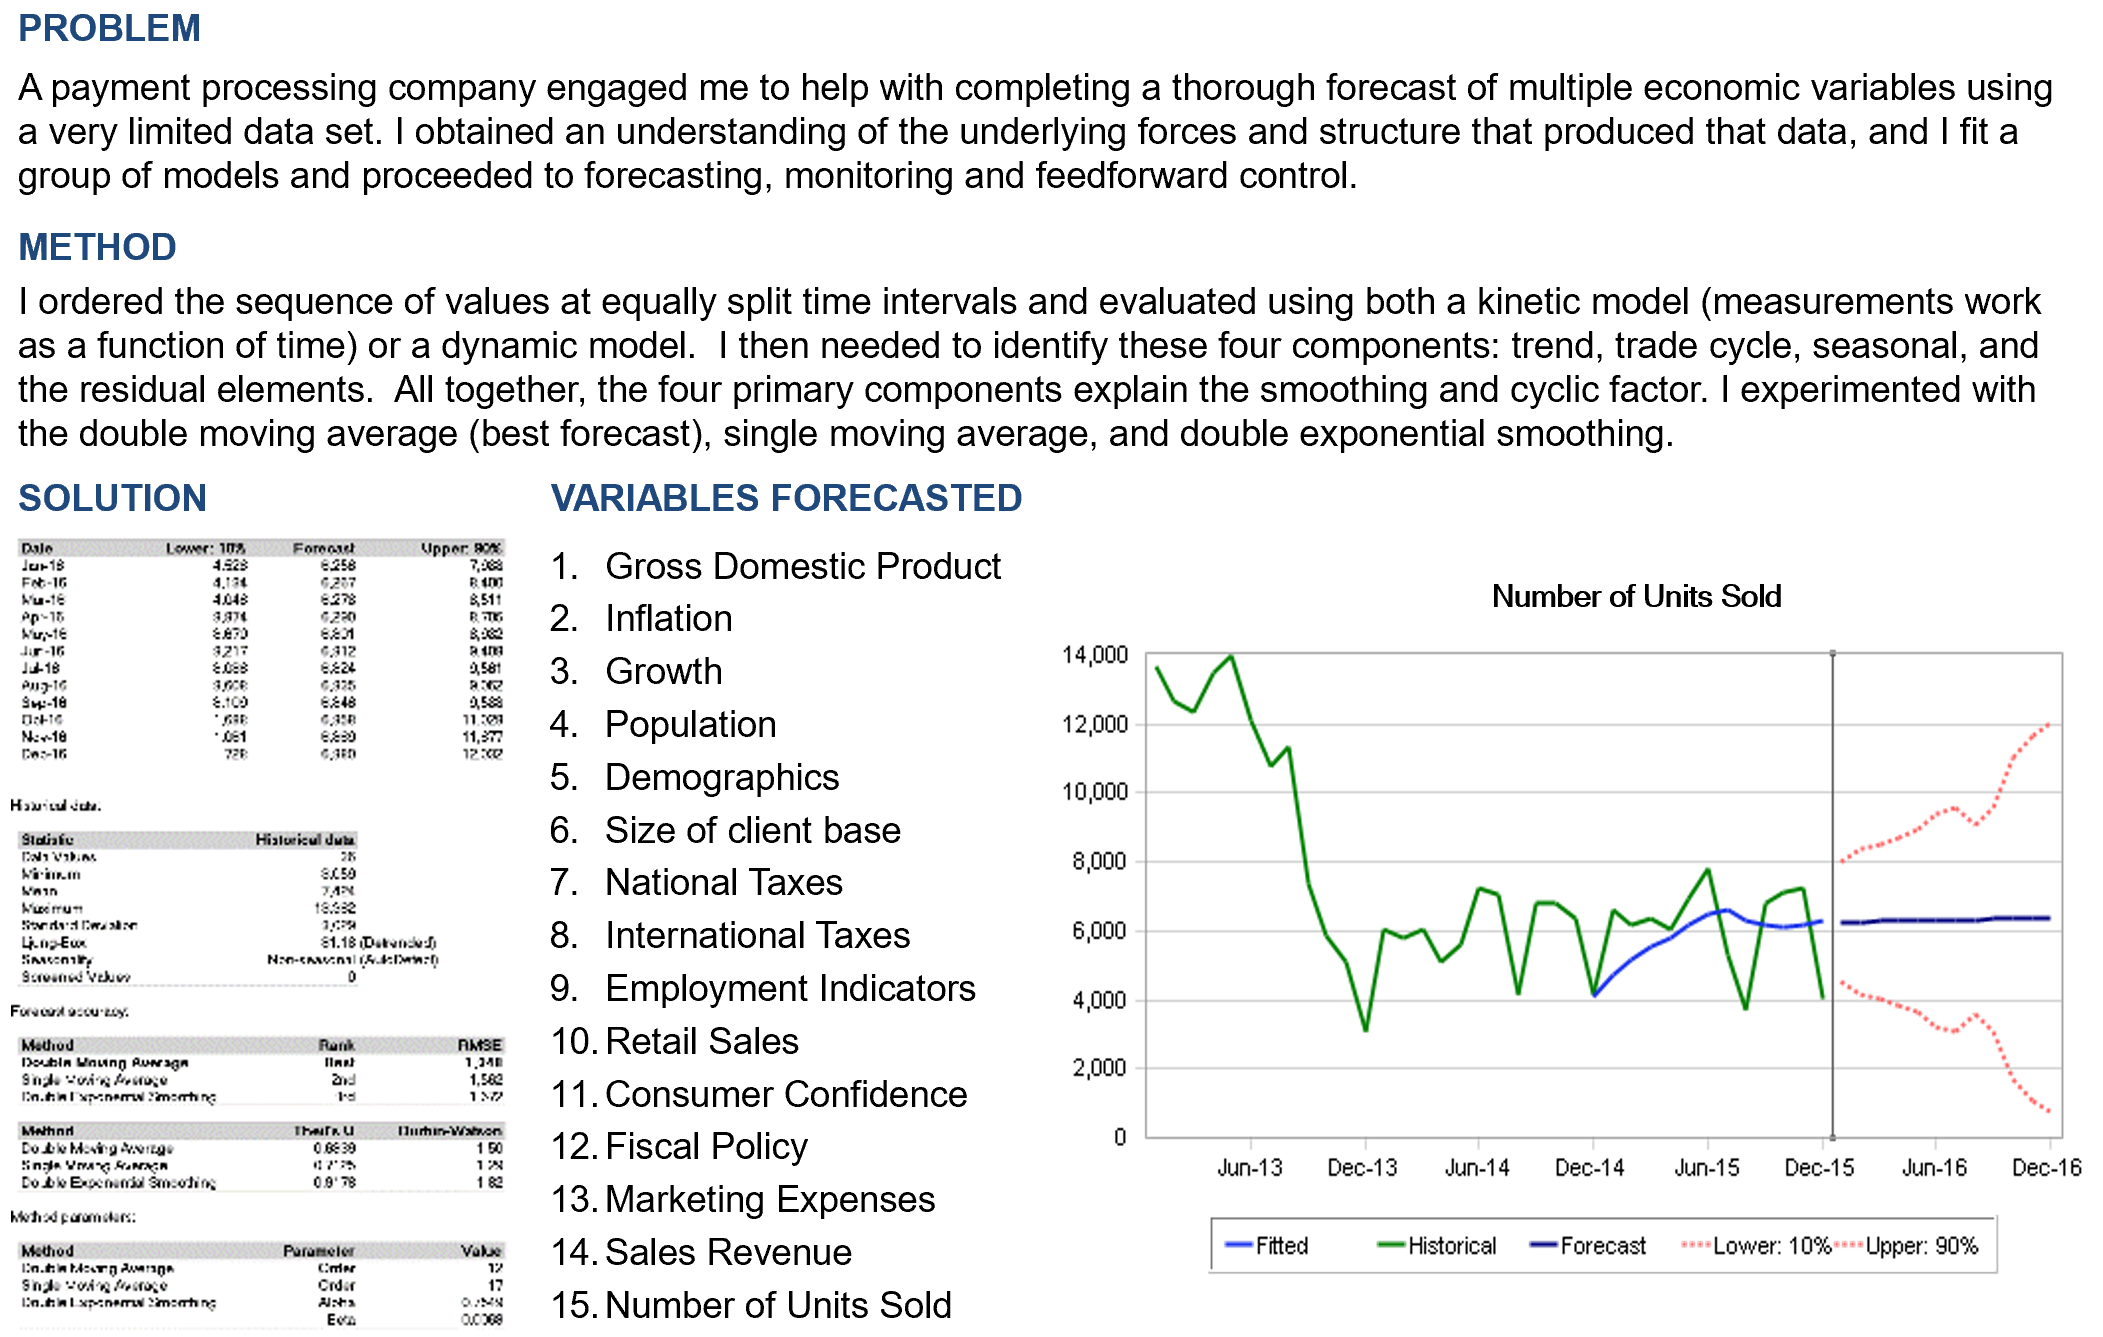
Problem
A payment processing company engaged me to help with completing a thorough forecast of multiple economic variables using a very limited data set. I obtained an understanding of the underlying forces and structure that produced that data, and I fit a group of models and proceeded to forecasting, monitoring and feedforward control.
Method
I ordered the sequence of values at equally split time intervals and evaluated using both a kinetic model (measurements work as a function of time) or a dynamic model. I then needed to identify these four components: trend, trade cycle, seasonal, and the residual elements. All together, the four primary components explain the smoothing and cyclic factor. I experimented with the double moving average (best forecast), single moving average, and double exponential smoothing.
Solution
- Gross Domestic Product
- Inflation
- Growth
- Population
- Demographics
- Size of client base
- National Taxes
- International Taxes
- Employment Indicators
- Retail Sales
- Consumer Confidence
- Fiscal Policy
- Marketing Expenses
- Sales Revenue
- Number of Units Sold
Case Study 6: How can I price more accurately?
Problem
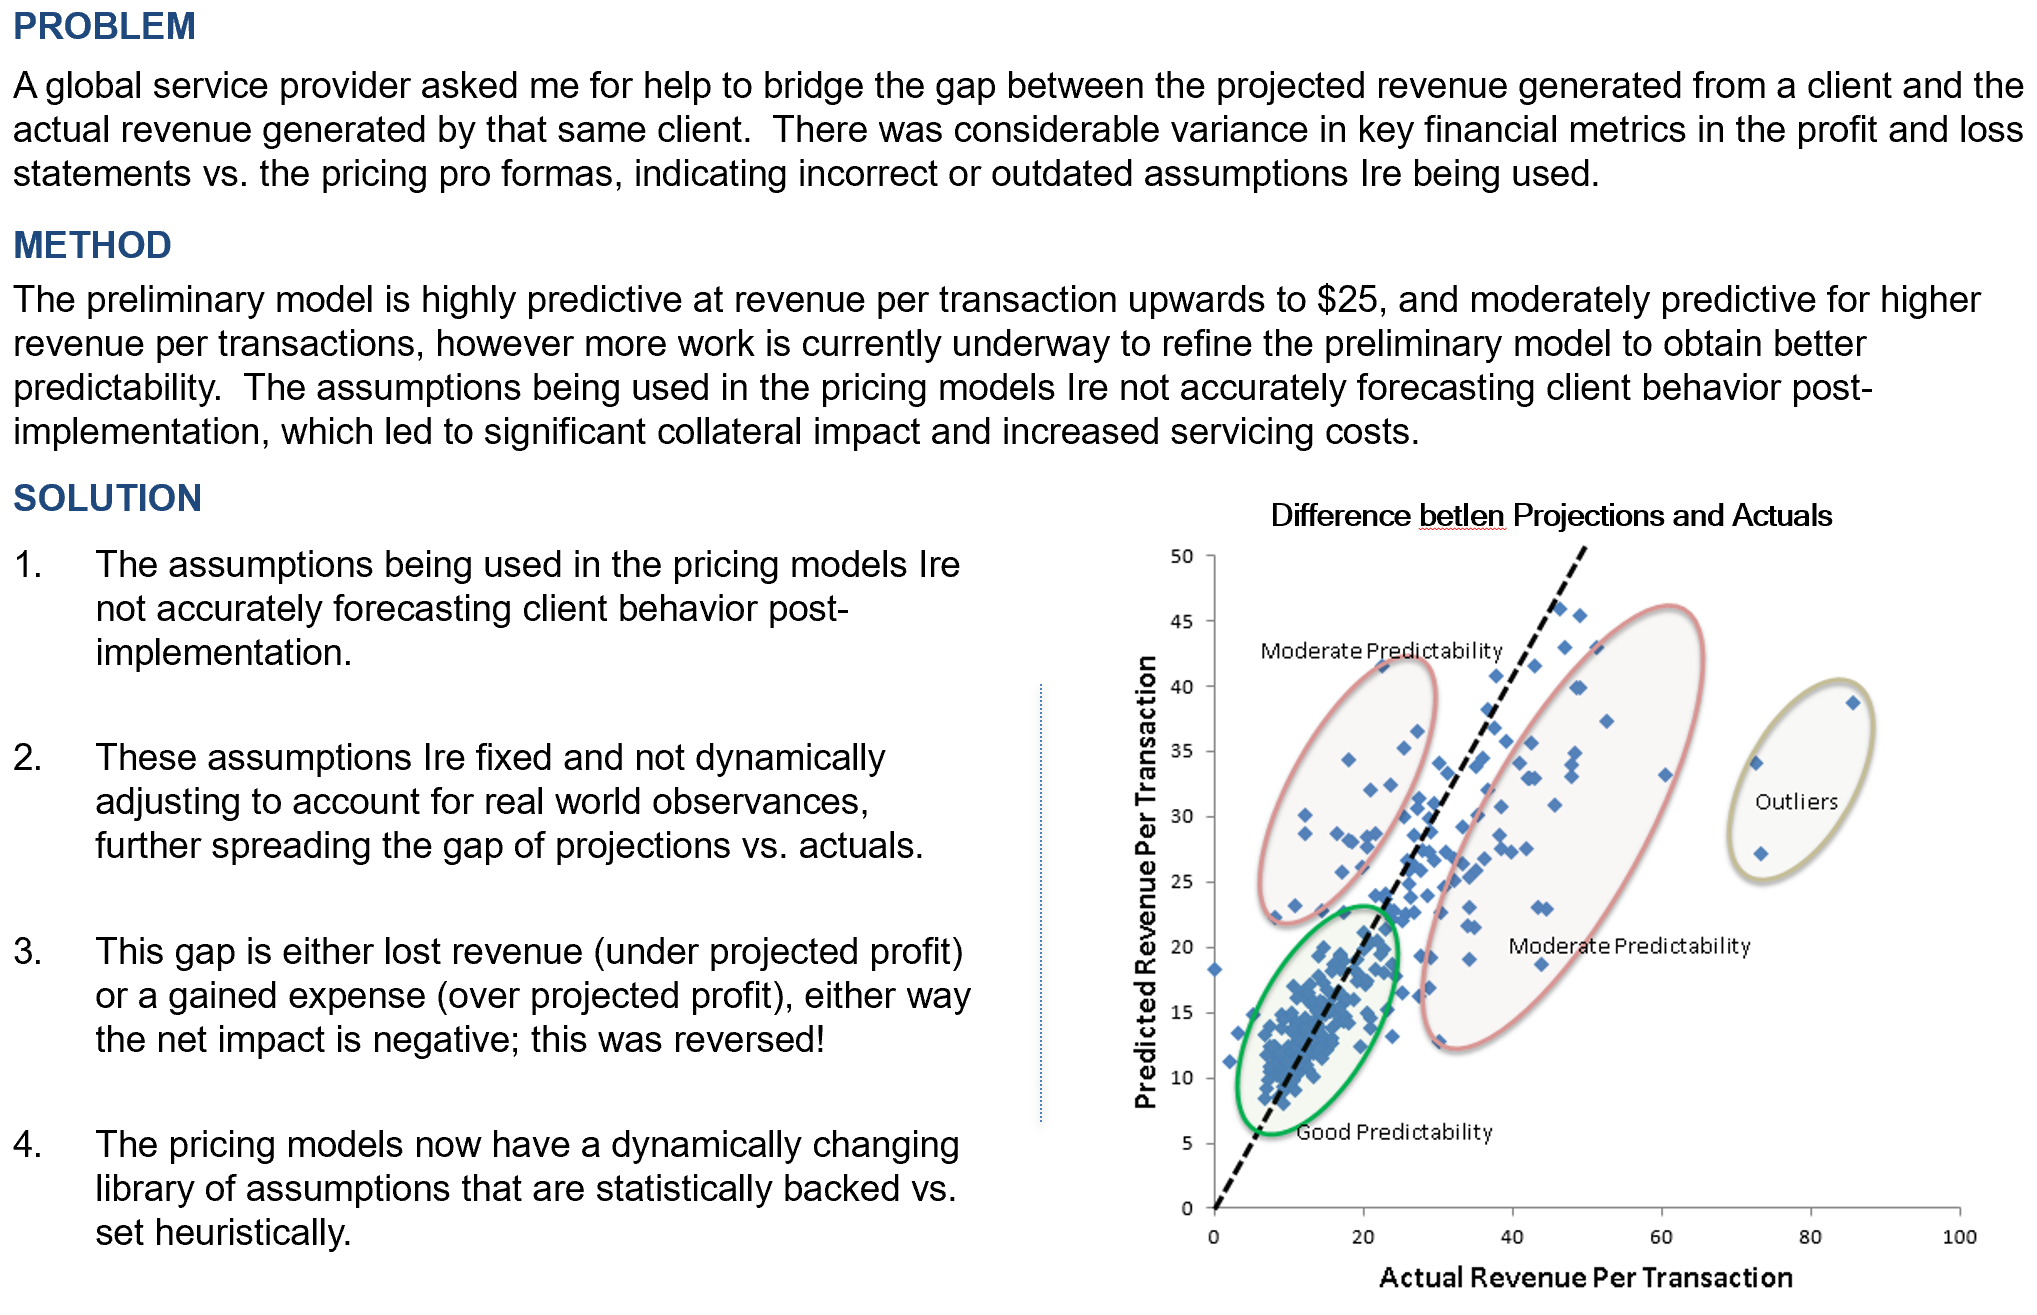
A global service provider asked me for help to bridge the gap between the projected revenue generated from a client and the actual revenue generated by that same client. There was considerable variance in key financial metrics in the profit and loss statements vs. the pricing pro formas, indicating incorrect or outdated assumptions Ire being used.
Method
The preliminary model is highly predictive at revenue per transaction upwards to $25, and moderately predictive for higher revenue per transactions, however more work is currently underway to refine the preliminary model to obtain better predictability. The assumptions being used in the pricing models Ire not accurately forecasting client behavior post-implementation, which led to significant collateral impact and increased servicing costs.
Solution
- The assumptions being used in the pricing models Ire not accurately forecasting client behavior post-implementation.
- These assumptions Ire fixed and not dynamically adjusting to account for real world observances, further spreading the gap of projections vs. actuals.
- This gap is either lost revenue (under projected profit) or a gained expense (over projected profit), either way the net impact is negative; this was reversed!
- The pricing models now have a dynamically changing library of assumptions that are statistically backed vs. set heuristically.
Case Study 7: Do our clients behave similarly or uniquely?
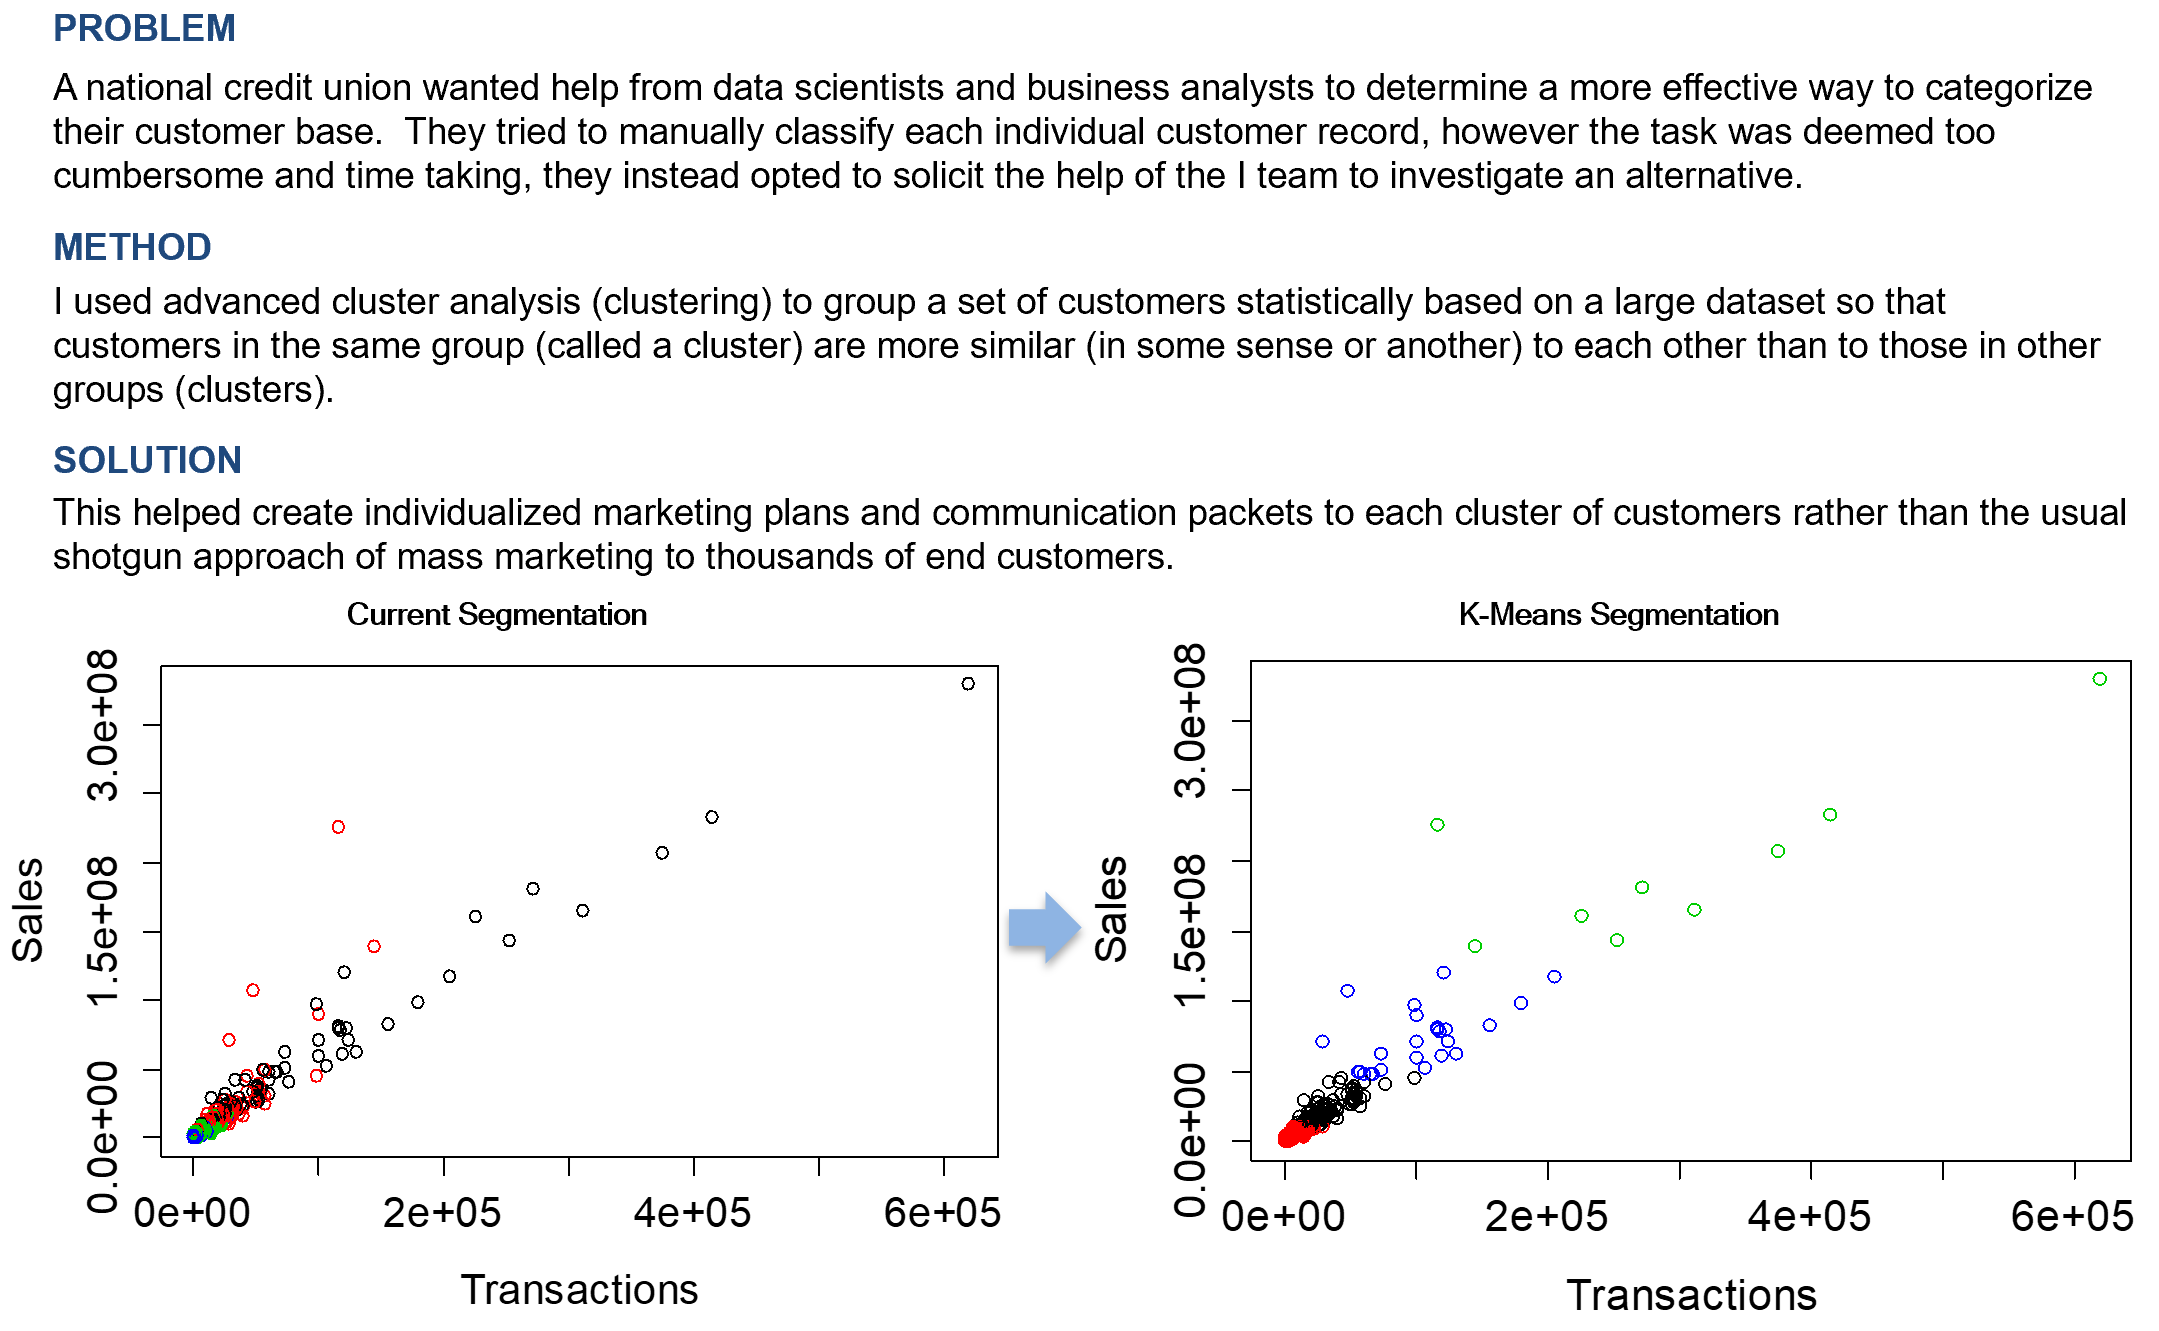
Problem
A national credit union wanted help from data scientists and business analysts to determine a more effective way to categorize their customer base. They tried to manually classify each individual customer record, however the task was deemed too cumbersome and time taking, they instead opted to solicit the help of the I team to investigate an alternative.
Method
I used advanced cluster analysis (clustering) to group a set of customers statistically based on a large dataset so that customers in the same group (called a cluster) are more similar (in some sense or another) to each other than to those in other groups (clusters).
Solution
This helped create individualized marketing plans and communication packets to each cluster of customers rather than the usual shotgun approach of mass marketing to thousands of end customers.
Case Study 8: What is the sensitivity of individual variables?
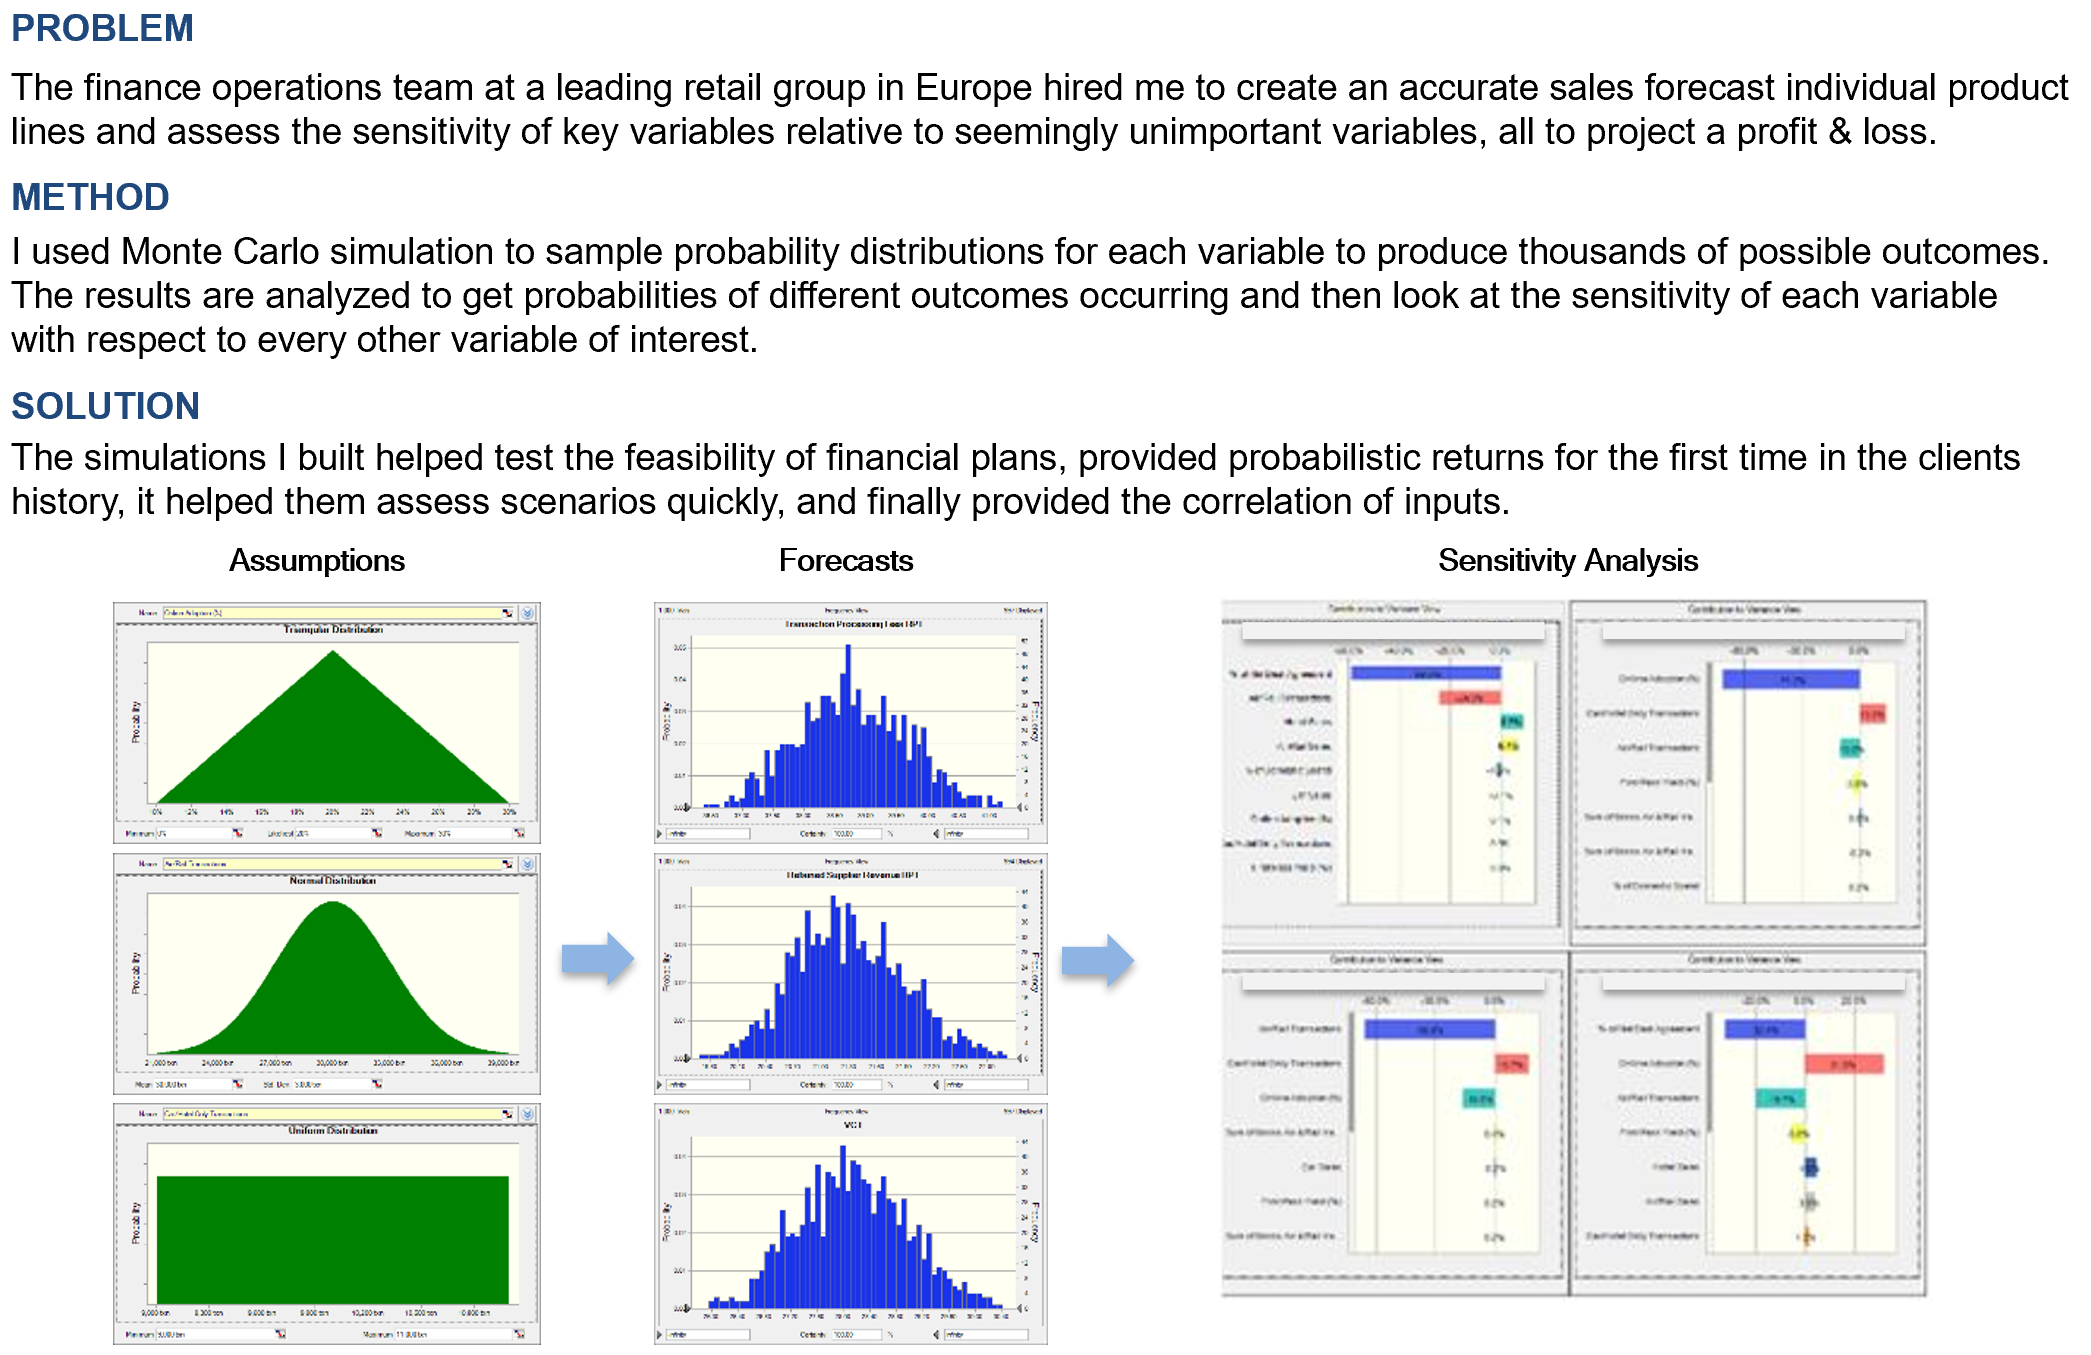
Problem
The finance operations team at a leading retail group in Europe hired me to create an accurate sales forecast individual product lines and assess the sensitivity of key variables relative to seemingly unimportant variables, all to project a profit & loss.
Method
I used Monte Carlo simulation to sample probability distributions for each variable to produce thousands of possible outcomes. The results are analyzed to get probabilities of different outcomes occurring and then look at the sensitivity of each variable with respect to every other variable of interest.
Solution
The simulations I built helped test the feasibility of financial plans, provided probabilistic returns for the first time in the clients history, it helped them assess scenarios quickly, and finally provided the correlation of inputs.
Case Study 9: How can I improve inventory management?
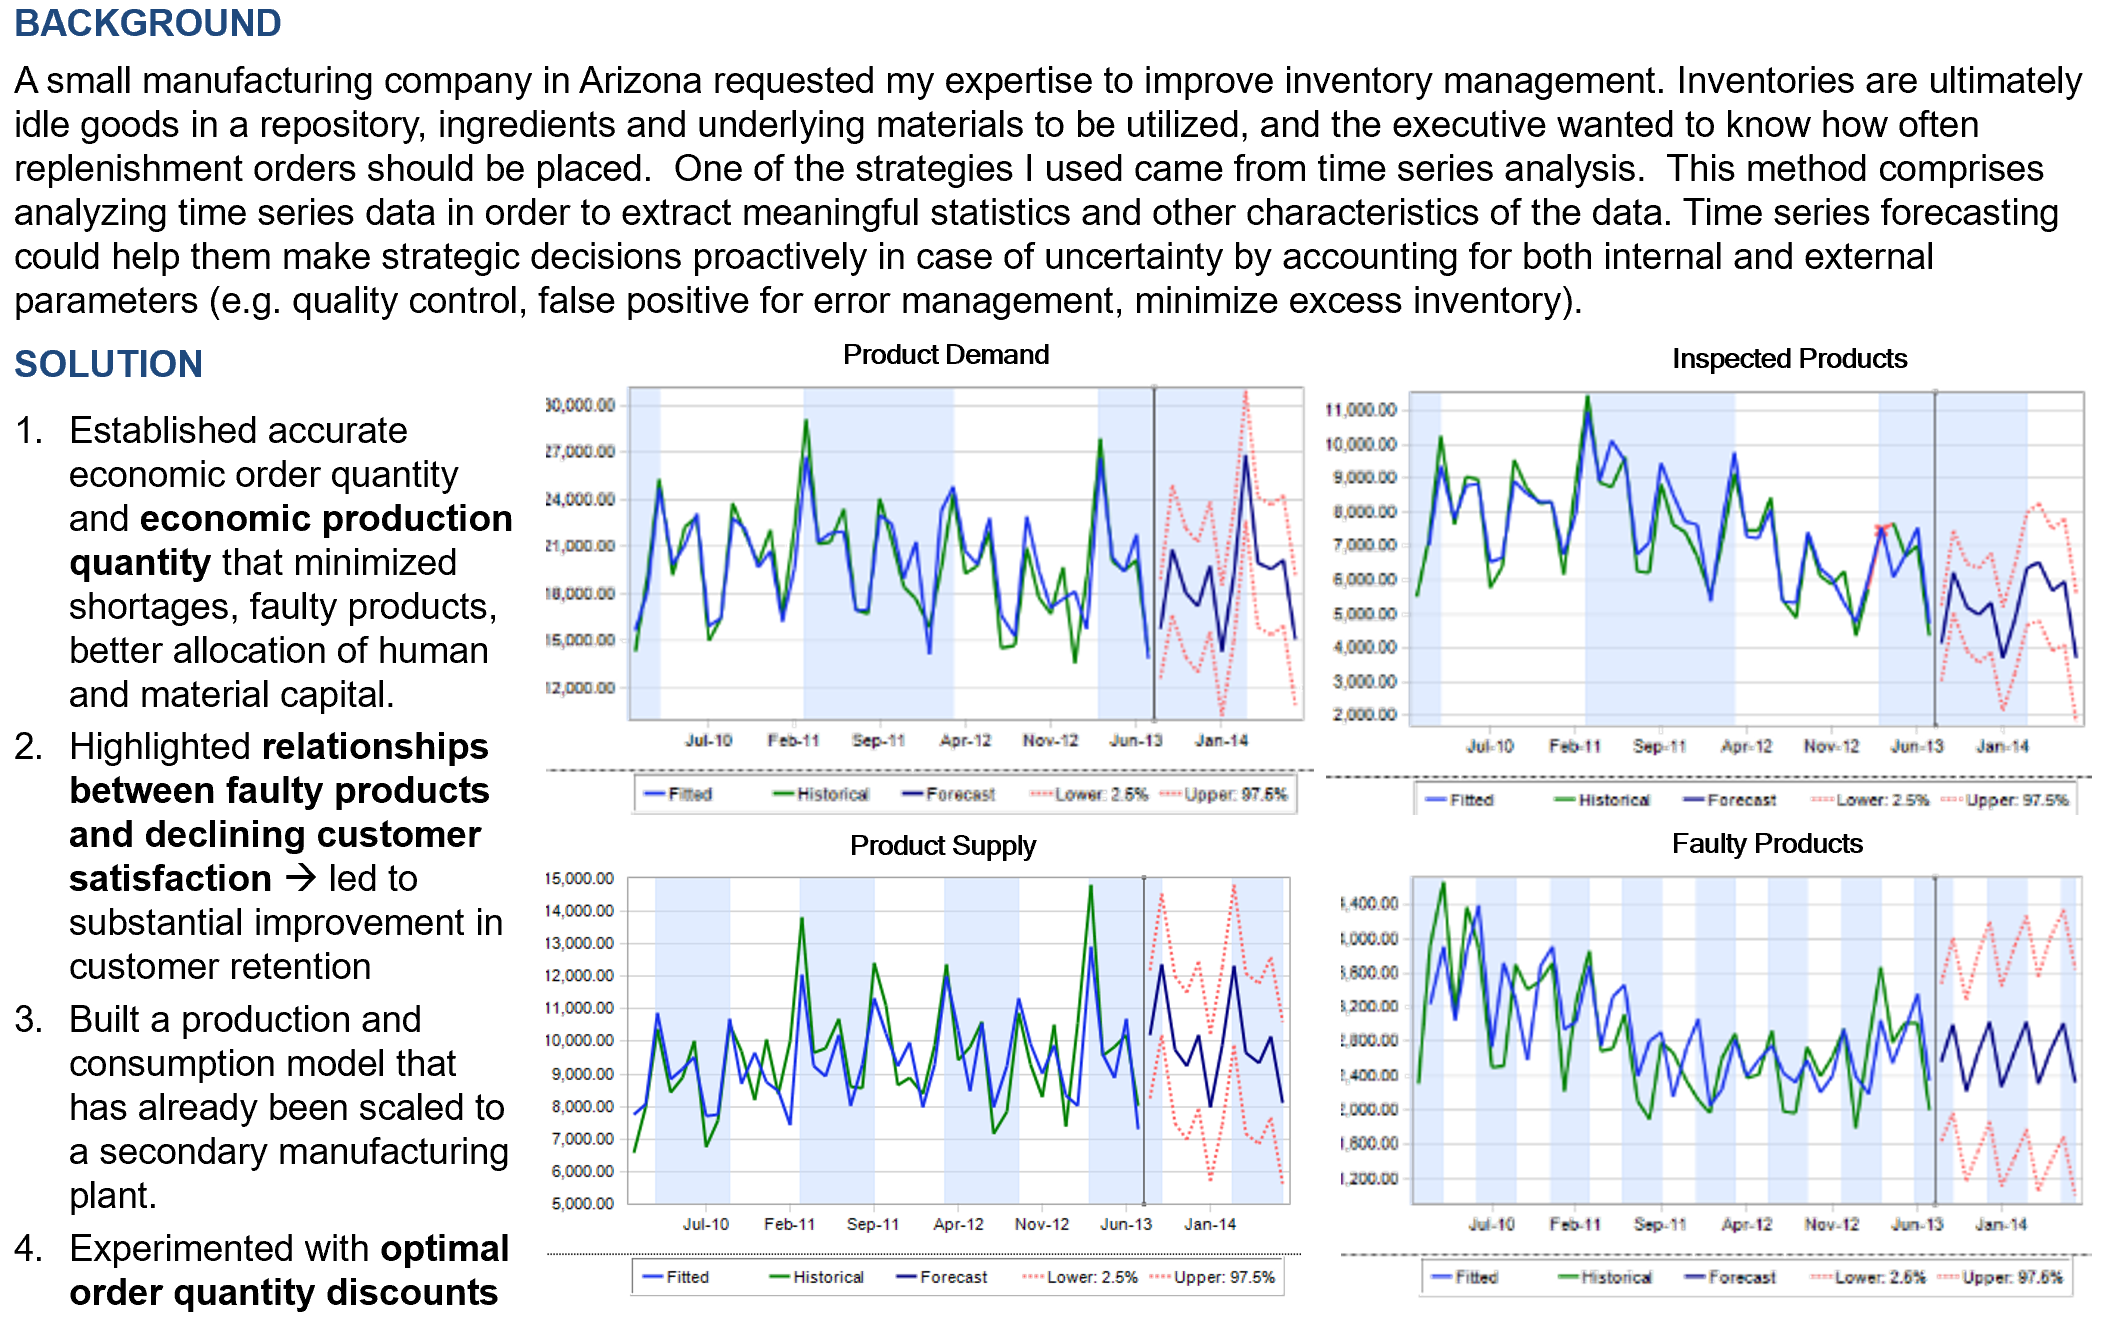
Background
A small manufacturing company in Arizona requested my expertise to improve inventory management. Inventories are ultimately idle goods in a repository, ingredients and underlying materials to be utilized, and the executive wanted to know how often replenishment orders should be placed. One of the strategies I used came from time series analysis. This method comprises analyzing time series data in order to extract meaningful statistics and other characteristics of the data. Time series forecasting could help them make strategic decisions proactively in case of uncertainty by accounting for both internal and external parameters (e.g. quality control, false positive for error management, minimize excess inventory).
Solution
- Established accurate economic order quantity and economic production quantity that minimized shortages, faulty products, better allocation of human and material capital.
- Highlighted relationships between faulty products and declining customer satisfaction à led to substantial improvement in customer retention
- Built a production and consumption model that has already been scaled to a secondary manufacturing plant.
- Experimented with optimal order quantity discounts
Case Study 10: Why is sales declining so fast?
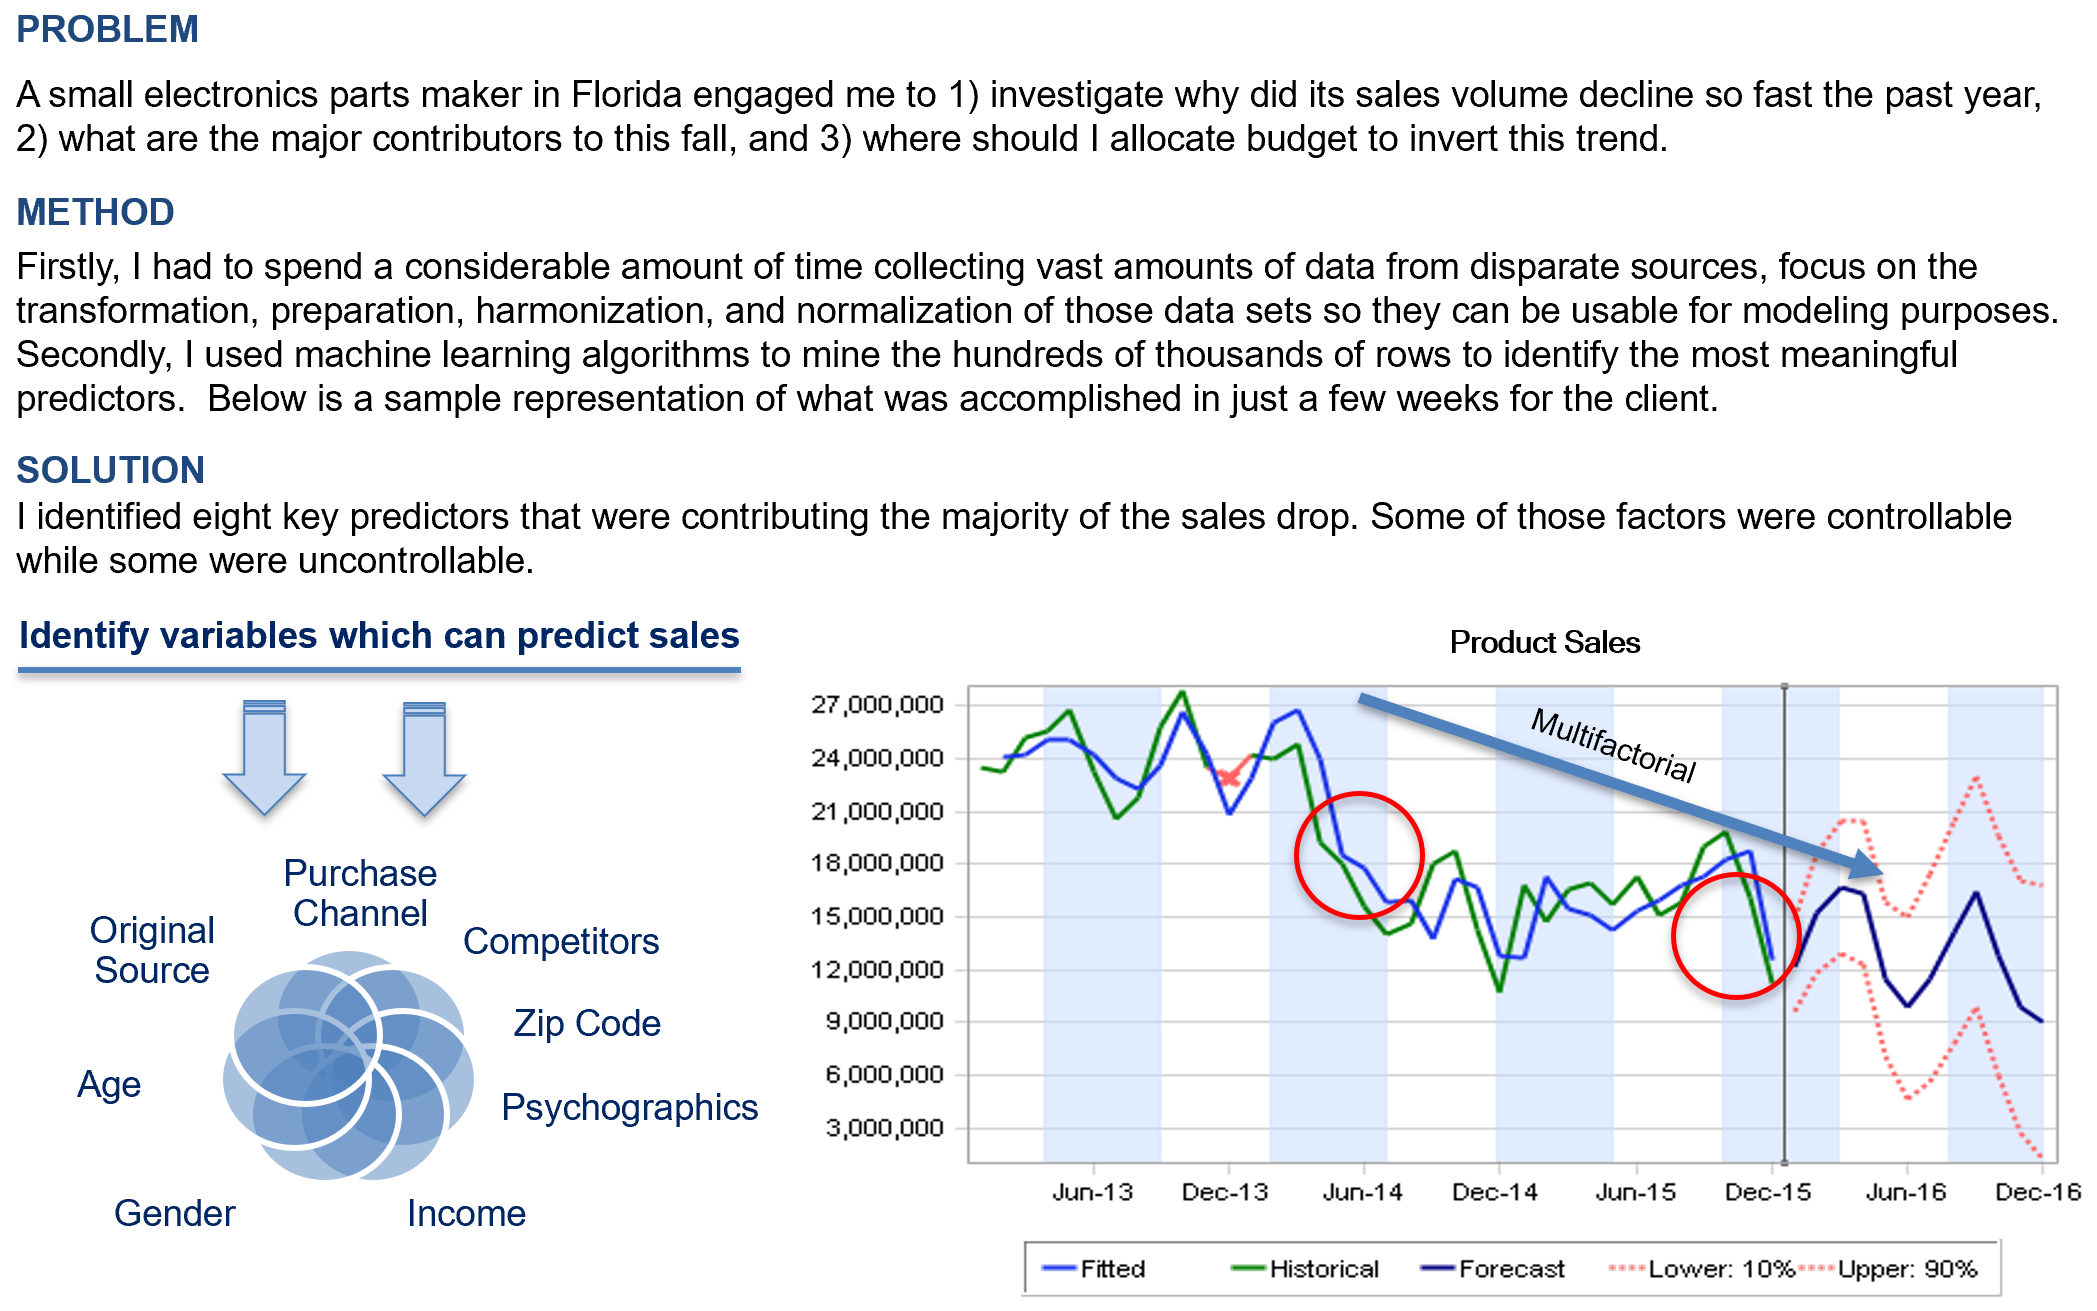
Problem
A small electronics parts maker in Florida engaged me to 1) investigate why did its sales volume decline so fast the past year, 2) what are the major contributors to this fall, and 3) where should I allocate budget to invert this trend.
Method
Firstly, I had to spend a considerable amount of time collecting vast amounts of data from disparate sources, focus on the transformation, preparation, harmonization, and normalization of those data sets so they can be usable for modeling purposes. Secondly, I used machine learning algorithms to mine the hundreds of thousands of rows to identify the most meaningful predictors. Below is a sample representation of what was accomplished in just a few weeks for the client.
Solution
I identified eight key predictors that were contributing the majority of the sales drop. Some of those factors were controllable while some were uncontrollable.
Case Study 11: What type of data professional do I need?
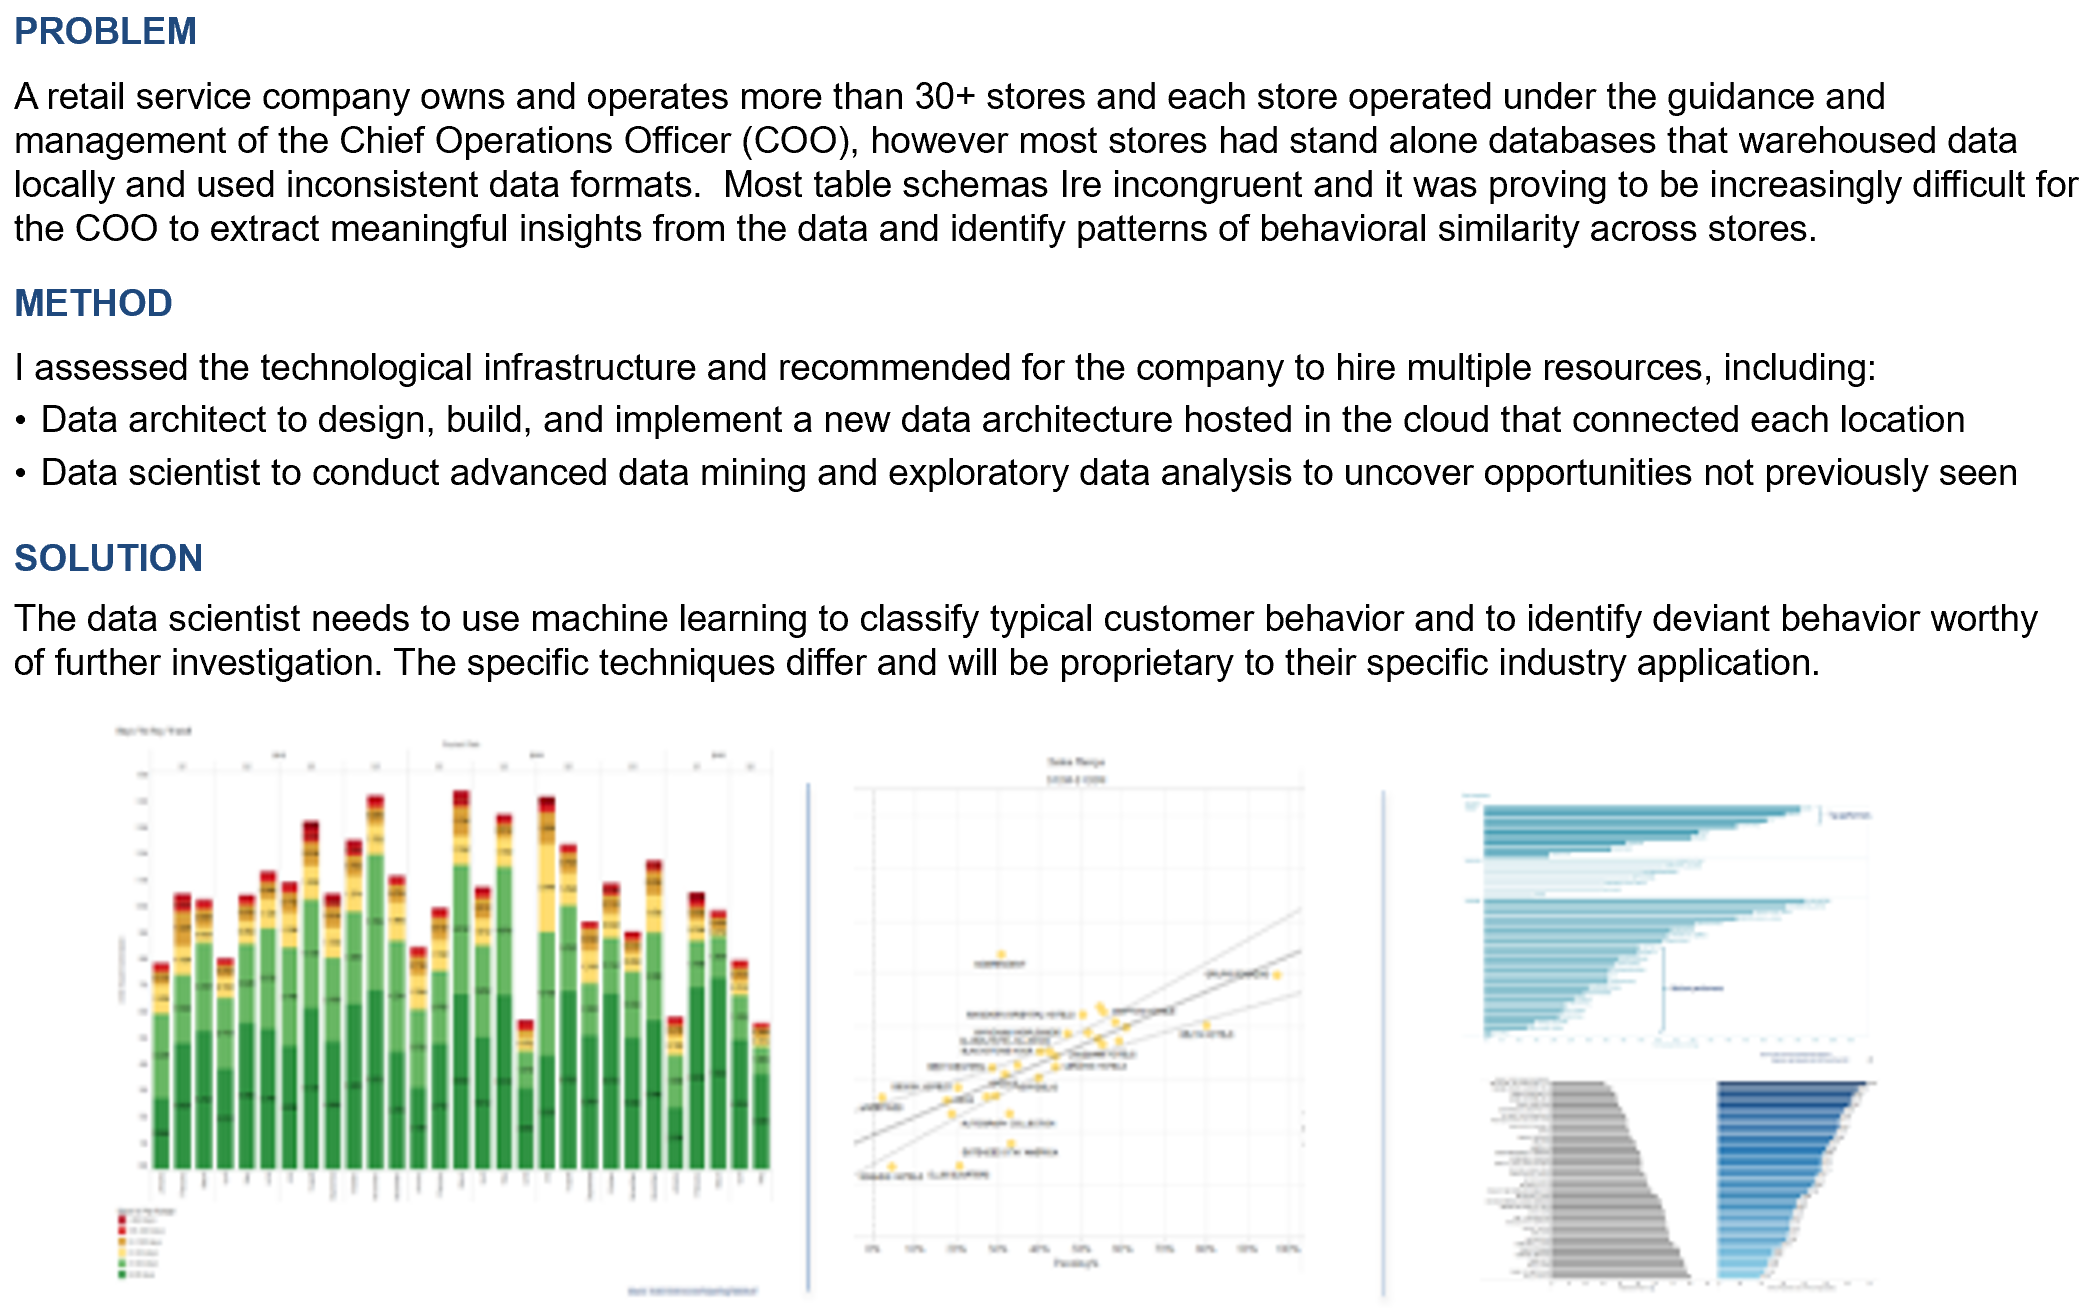
Problem
A retail service company owns and operates more than 30+ stores and each store operated under the guidance and management of the Chief Operations Officer (COO), however most stores had stand alone databases that warehoused data locally and used inconsistent data formats. Most table schemas Ire incongruent and it was proving to be increasingly difficult for the COO to extract meaningful insights from the data and identify patterns of behavioral similarity across stores.
Method
I assessed the technological infrastructure and recommended for the company to hire multiple resources, including:
- Data architect to design, build, and implement a new data architecture hosted in the cloud that connected each location
- Data scientist to conduct advanced data mining and exploratory data analysis to uncover opportunities not previously seen
Solution
The data scientist needs to use machine learning to classify typical customer behavior and to identify deviant behavior worthy of further investigation. The specific techniques differ and will be proprietary to their specific industry application.
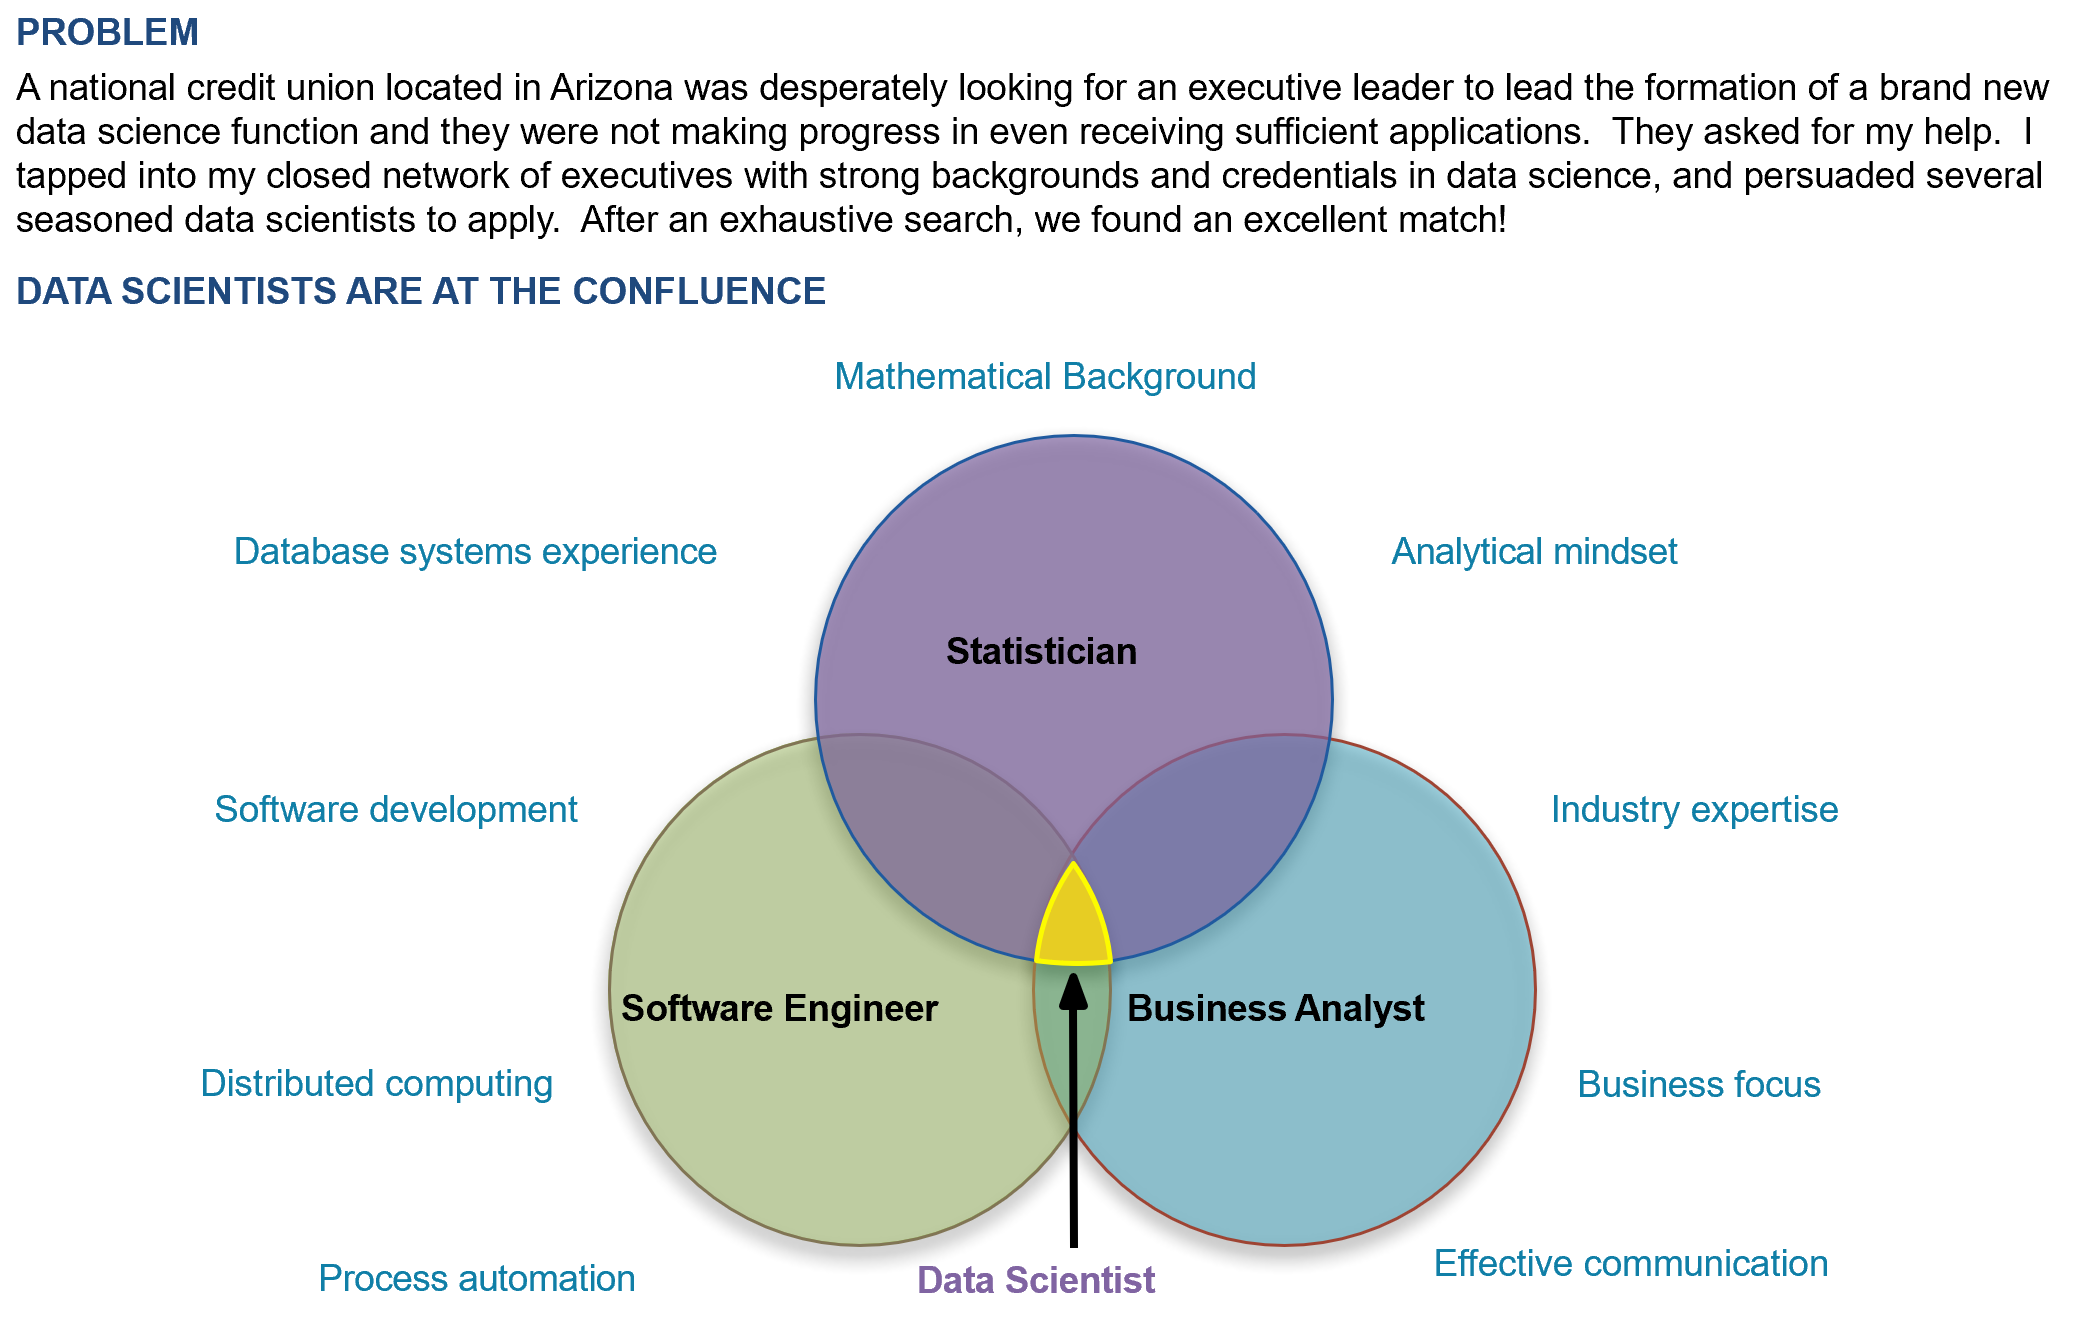
Case Study 12: I need a proven leader in data science?
Problem
A national credit union located in Arizona was desperately looking for an executive leader to lead the formation of a brand new data science function and they were not making progress in even receiving sufficient applications. They asked for my help. I tapped into my closed network of executives with strong backgrounds and credentials in data science, and persuaded several seasoned data scientists to apply. After an exhaustive search, we found an excellent match!
Data Scientists Are At The Confluence
 If you ever need help with data science, business analytics, data transformation, data and analytics, machine learning, data mining, and really anything to do with data, please do not hesitate to reach out! Happy to support.